
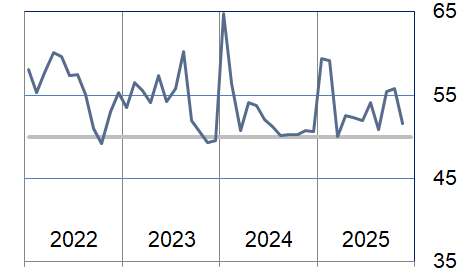
Houston PMI at 50.9 (down 2.8 points from October)
Sales/New Orders Expanding
Production Expanding
Employment Expanding
Prices Paid Expanding
Lead Times Contracting
Finished Goods Inventories Expanding
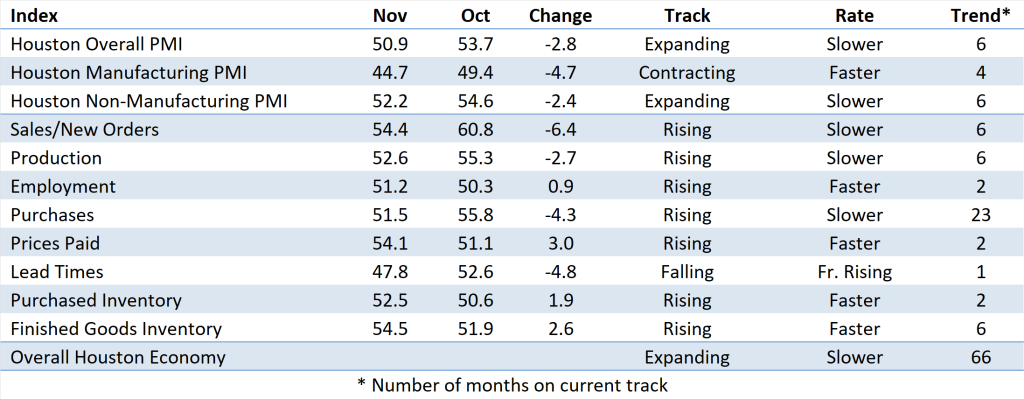
(Houston, Texas) – According to Houston area supply chain executives, economic activity in Houston continued to expand in November. The manufacturing sector contracted for the fourth month, while nonmanufacturing expanded for the sixth month. The overall economy expanded for the 66th month in a row.
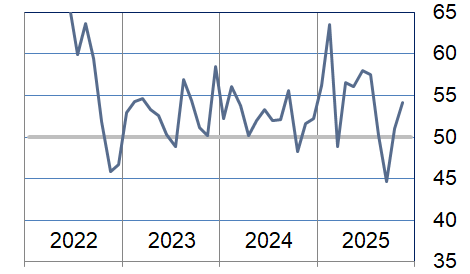
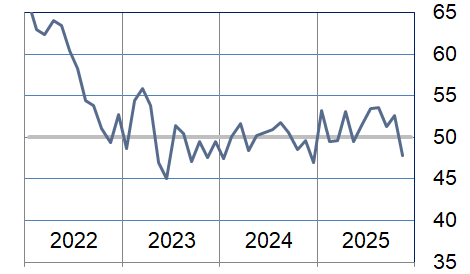
The overall Houston Purchasing Managers Index expanded at a slower rate at 50.9 points, falling 2.8 points from October. Of the three underlying indicators that have a strong direct correlation with economic activity, sales/new orders and employment continued to show strength. The third, lead times, moved from indicating expansion to pointing to contraction. The sales/new orders index fell 6.4 points to 54.4 points, indicating expansion at a slower rate. The employment index rose to 51.2 points, up 0.9 points from the previous month, continuing to point to rising employment. The lead times index fell 4.8 points to 47.8 points, indicating contraction for the first time in six months. The finished goods inventory index, the underlying indicator that has the strongest inverse correlation with economic activity, rose 2.6 points to 54.5 points, indicating expansion for this indicator the fifth month in a row.
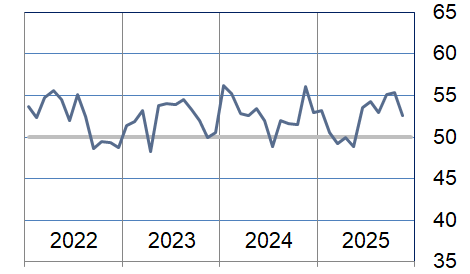
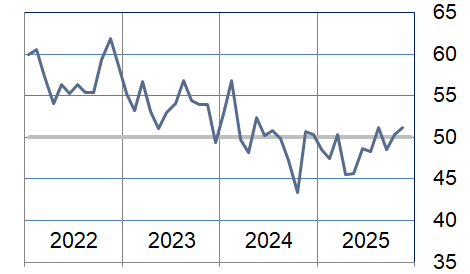
The Houston manufacturing PMI index fell 4.7 points during the month to 44.7 points, indicating much faster contraction in this sector. The nonmanufacturing PMI fell 2.4 points to 52.2 points.
On an industry specific basis: health care, construction, and professional services reported strong expansion. Retail trade, durable goods manufacturing, non-durable goods manufacturing, and oil production all reported weakness.
Please click here for the hard copy report.
Indices at a Glance
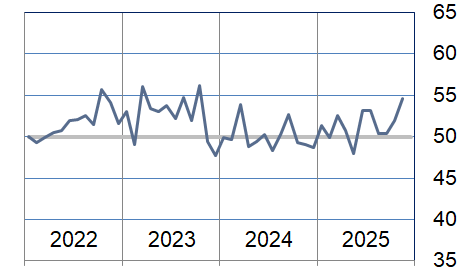
Houston PMI Trend
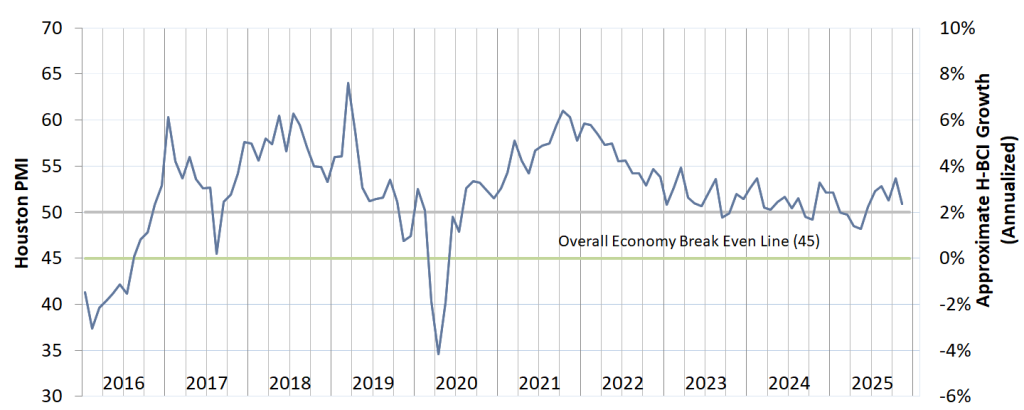
Houston PMI readings over 50 generally indicate that respondents see their activities as expanding. An HPMI above 45 normally correlates with expansion of the Houston-The Woodlands-Sugar Land Business Cycle Index (H-BCI).
Commodities Reported to have Notable Price Changes or to be in Short Supply
Up in Price: Motor fuels*, natural gas; oil field chemicals, ethane, propane*, natural gas liquids; film; electrical equipment, stainless steel, rebar, carbon steel*, aluminum shapes, rhodium, cobalt, tungsten; overland trucking, ocean freight, breakbulk ocean freight, ocean container freight
Down in Price: Motor fuels*; propane*, ethylene, propylene, ethylene oxide and derivatives; nickel, copper, carbon steel*, structural steel, lumber; bulk liquid storage; steel, nickel, copper; domestic and ocean container freight
In Short Supply: Skilled labor; electrical gear, electrical equipment, electrical components, automation equipment, instrumentation, transformers; Teflon fine wire, some thin stainless coil, high count fiber cable, tape, tungsten
* reported as up or down by different respondents
What our Respondents are Saying
Oil and Gas Exploration, and Key Support Services:
- We are still reviewing strategies to deal with the impacts of new tariffs.
- We are making budget cuts for 2026.
- Rare earth mineral and associated licenses are being reviewed.
- Lowering expectations for 2026
- This sector returned to indicating contraction this month. The purchases and lead times indices moved significantly lower pointing to a strong indication of contraction. Production and employment came in flat on a month-to-month basis.
Construction:
- Copper, aluminum, and nickel prices seem to have stabilized, albeit at a relatively high level.
- The sector continues to experience strong expansion with the sales/new orders, employment, and purchases indices showing significant strength. Prices paid and lead times where relatively flat month-to-month.
Durable Goods Manufacturing:
- The lack of new oil drilling activity is affecting incoming sales and overall growth.
- This sector moved from flat growth back to significant contraction during the month. The sales/new orders and employment indices were reported as much weaker. While the production index remained flat, both the purchased goods and finished inventory indices rose well above neutral. A majority of the respondents in this sector also reported prices paid as rising.
Non-durable Goods Manufacturing:
- We have been making adjustments based on tariff impacts and expect our optimization to be complete by early 2026; even with the adjustments, we will see increases in cost of goods sold (COGS).
- The effects of tariffs are starting to show.
- Refinery rates rose in November consistent with normal seasonal changes.
- Our business is stable for now.
- Natural gas and propane prices have risen significantly in early December due to higher demand, presumably caused by cold weather.
- Ethylene and propylene prices are very low.
- Precious metal prices (gold, silver, platinum, and palladium) continue to be high; we believe this is driven by market speculation as opposed to commercial demand.
- This sector showed further weakness in November with the sales/new orders and employment indices falling further below neutral. The production and purchases indices were flat month to month, but the prices paid index rose in line with the reports from our durable goods respondents
Wholesale and Retail Trade:
- Imported goods costs remain higher.
- Growth has slowed reflecting higher costs of imported goods.
- We have made some minor reductions in labor but expected to be static over the next 6 months.
- This sector reported moderate weakness during the month. A strong sales/new orders index could not make up for weak results in the employment, purchases, and lead times indices. A high finished goods inventory index also suppressed results.
Professional and Business Services:
- The number of major projects has increased substantially across industries including nuclear power, infrastructure, LNG, data centers, etc.
- With the exception of positions that require highly specific skills, there is no shortage of qualified people available for job openings.
- Oil prices continue to be below what energy companies need for capital expansion. This is particularly true for upstream and downstream. Mid-Stream seems to be in a much better position for future spending and growth.
- We have not seen any decrease in what companies are willing to pay for contract or direct hire positions even though qualified people are generally available.
- This sector continues to report expansion led by strength in the employment and purchases indices. All other indices were relatively flat month over month.
Trend of Underlying Indicators
The Houston PMI is based on diffusion indices for eight underlying indicators. The net value of each indicator is simply the percentage of respondents who cite a positive shift from the previous month minus the percentage who cite a negative shift. The diffusion index is calculated based on the percent of respondents reporting higher results plus one-half of those responding the same with seasonal adjustments to the Sales/New Orders, Production, Employment, and Prices Paid indices based on an X13 ARIMA forecast. Values above 50 for Sales/New Orders, Production, Employment, Prices Paid, and Lead Times generally point towards expansion and values below 50 signal contraction. Note that the Prices Paid Index may not follow this trend late in an economic expansion. The Inventory measures have an inverse correlation at most forecast horizons, meaning that values below 50 point to expansion and values above point to contraction. The Purchases index is inversely correlated with economic activity at the three-month forecast horizon.
Sales/New Orders (Seasonally Adjusted)
The overall sales/new orders index fell during the month, but continues to point to expansion. Nonmanufacturing sales expanded at a modestly slower pace and manufacturing contracted at a faster pace.
| Higher | Same | Lower | Net | Index | |
| Jun/25 | 20% | 67% | 13% | 7% | 53.6 |
| Jul/25 | 20% | 75% | 5% | 15% | 58.6 |
| Aug/25 | 14% | 82% | 4% | 10% | 55.6 |
| Sep/25 | 11% | 86% | 3% | 8% | 55.6 |
| Oct/25 | 16% | 79% | 5% | 11% | 60.8 |
| Nov/25 | 11% | 83% | 6% | 5% | 54.4 |

Production Index (Seasonally Adjusted)
The production index fell modestly with both non-manufacturing and manufacturing reporting expansion in this index at a very slow rate.
| Higher | Same | Lower | Net | Index | |
| Jun/25 | 14% | 78% | 8% | 6% | 53.6 |
| Jul/25 | 12% | 86% | 2% | 10% | 54.2 |
| Aug/25 | 10% | 87% | 3% | 7% | 52.9 |
| Sep/25 | 12% | 84% | 4% | 8% | 55.2 |
| Oct/25 | 11% | 85% | 4% | 7% | 55.3 |
| Nov/25 | 9% | 86% | 5% | 4% | 52.6 |
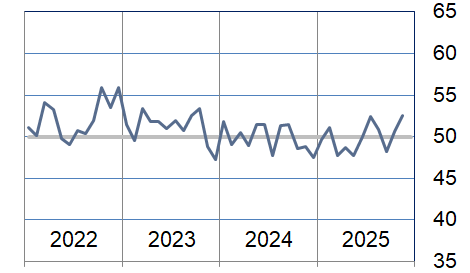
Employment Index (Seasonally Adjusted)
This index was reported as expanding at a slightly faster rate. Manufacturing continues to report this index as contracting at a rapid pace. Non-manufacturing is reporting modest expansion in this index.
| Higher | Same | Lower | Net | Index | |
| Jun/25 | 8% | 83% | 9% | -1% | 48.6 |
| Jul/25 | 6% | 84% | 10% | -4% | 48.3% |
| Aug/25 | 9% | 82% | 9% | 0% | 51.2 |
| Sep/25 | 11% | 72% | 17% | -6% | 48.5 |
| Oct/25 | 8% | 83% | 9% | -1% | 50.3 |
| Nov/25 | 9% | 83% | 8% | 1% | 51.2 |
Purchases Index (Seasonally Adjusted)
The purchases index fell to just above neutral, showing very limited expansion. Both non-manufacturing and manufacturing reporting at similar levels.
| Higher | Same | Lower | Net | Index | |
| Jun/25 | 14% | 75% | 11% | 3% | 51.9 |
| Jul/25 | 13% | 82% | 5% | 8% | 54.1% |
| Aug/25 | 7% | 87% | 6% | 1% | 50.8 |
| Sep/25 | 16% | 76% | 8% | 8% | 55.5 |
| Oct/25 | 15% | 78% | 7% | 8% | 55.8 |
| Nov/25 | 14% | 71% | 15% | -1% | 51.5 |
Prices Paid Index (Seasonally Adjusted)
This index was reported as expanding at a modestly higher rate. Non-manufacturing remained near neutral while manufacturing saw a significant increase to well above this level.
| Higher | Same | Lower | Net | Index | |
| Jun/25 | 18% | 78% | 4% | 14% | 57.9 |
| Jul/25 | 17% | 80% | 3% | 14% | 57.6 |
| Aug/25 | 12% | 77% | 11% | 1% | 50.1 |
| Sep/25 | 9% | 74% | 17% | -8% | 44.7 |
| Oct/25 | 12% | 78% | 10% | 2% | 51.1 |
| Nov/25 | 13% | 75% | 12% | 1% | 54.1 |
Lead Times Index (Seasonally Adjusted)
The lead times index fell below neutral with both manufacturing and non-manufacturing coming in at this level. The drop in this index for manufacturing was significant.
| Higher | Same | Lower | Net | Index | |
| Jun/25 | 6% | 91% | 3% | 3% | 51.7 |
| Jul/25 | 10% | 88% | 2% | 8% | 53.5% |
| Aug/25 | 8% | 90% | 2% | 6% | 53.6% |
| Sep/25 | 7% | 90% | 3% | 4% | 51.3 |
| Oct/25 | 8% | 87% | 5% | 3% | 52.6 |
| Nov/25 | 2% | 89% | 9% | -7% | 47.8 |
Purchased Inventory Index (Seasonally Adjusted)
This index rose modestly with manufacturing indicating modest contraction while non-manufacturing reported modest expansion.
| Higher | Same | Lower | Net | Index | |
| Jun/25 | 6% | 89% | 5% | 1% | 50.0 |
| Jul/25 | 6% | 91% | 3% | 3% | 52.4% |
| Aug/25 | 7% | 89% | 4% | 3% | 50.9 |
| Sep/25 | 6% | 85% | 9% | -3% | 48.3 |
| Oct/25 | 6% | 87% | 7% | -1% | 50.6 |
| Nov/25 | 8% | 89% | 3% | 5% | 52.5 |
Finished Goods Inventory Index (Seasonally Adjusted)
The finished goods inventory index rose similar amounts for both manufacturing and non-manufacturing to end the month indicating modest expansion for the index.
| Higher | Same | Lower | Net | Index | |
| Jun/25 | 9% | 88% | 3% | 6% | 53.1 |
| Jul/25 | 8% | 90% | 2% | 6% | 53.1 |
| Aug/25 | 5% | 91% | 4% | 1% | 50.4 |
| Sep/25 | 8% | 85% | 7% | 1% | 50.3 |
| Oct/25 | 10% | 84% | 6% | 4% | 51.9 |
| Nov/25 | 13% | 84% | 3% | 10% | 54.5 |
Background on the ISM-Houston Business Report and HPMI Calculation Methods
The Houston Purchasing Managers Index has been included as an integral part of the ISM-Houston Business Report since the Houston chapter of the Institute for Supply Management started publication of this document in January 1995. The report and index are published monthly as the primary deliverables from a survey of Houston area Supply Chain leaders regarding the status of key activities believed to provide insight into the strength of the economy. The respondents come from diverse organizations including construction, energy, engineering, health care, durable and non-durable goods manufacturing, financial and business services, wholesale and retail trade, and utilities related companies.
The Houston Purchasing Managers Index is determined from diffusion indices of the eight indicators of economic activity covered by the ISM-Houston Business Survey and Report. These underlying indicators are sales or new orders, production, employment, purchases, prices paid for major purchases, lead times from sellers, purchased materials inventory (raw materials and supplies), and finished goods inventories. The respondents to the survey report the direction of each these activities as either up, the same or down in comparison to the previous month. An index for each of these areas is then calculated by subtracting the percentage of respondents that sight a negative shift from the percentage that sight a positive shift. For indicators that are positively correlated with economic growth, this results in an underlying index that points to expansion when it is above zero. Indicators that are negatively correlated with growth point to expansion when they are below zero.
The final Houston PMI is calculated by applying optimal regression factors to each of the eight underlying indicators noted above. These regression factors are determined using standard regression techniques comparing these underlying indicators to the Houston-The Woodlands-Sugar Land Business Cycle Index (Houston BCI), which is reported on a monthly basis by the Federal Reserve Bank of Dallas. This top-level index is converted to a 0 to 100 scale to match that of the national Purchasing Managers Index® (PMI®) which is published monthly by the Institute for Supply Management® (ISM®). Readings over 50 for the HPMI generally indicate manufacturing expansion in the Houston in the near term and readings below 50 show coming manufacturing contraction.
It is important to note that the manufacturing breakeven HPMI does not equate to the breakeven point for the overall Houston economy. ISM-Houston periodically reviews the capability of its correlations and adjusts the regression factors when appropriate. The most recent revision occurred as a result of a review undertaken during the third quarter of 2018, which determined that changes in the Houston economy over the last decade have shifted the intercept of the correlation, causing a neutral Houston PMI to no longer align with a neutral Houston BCI. A Houston PMI of 45 points now equates to a neutral Houston economy as measured by the Houston BCI. A similar offset between the National PMI and the National economy has existed for some time.
Use of ISM-Houston Business Report Content
All information contained in this report is protected by copyright laws and ISM-Houston retains all rights to this Content. ISM-Houston hereby grants you a limited, revocable license to access, print, and display this Content solely for your personal, non-commercial use. Requests for permission to reproduce or redistribute ISM-Houston Business Report Content can be made by contacting the ISM-Houston Business Survey Committee at hpmi@ism-houston.org.
ISM-Houston shall not have any liability, duty, or obligation for or relating to the ISM-Houston Business Report Content or other information contained herein, any errors, inaccuracies, omissions or delays in providing any ISM-Houston Business Report Content, or for any actions taken in reliance thereon. In no event shall ISM-Houston be liable for any special, incidental, or consequential damages, arising out of the use of the ISM-Houston Business Report.