
For release November 10, 2023
October ISM-Houston Business Report
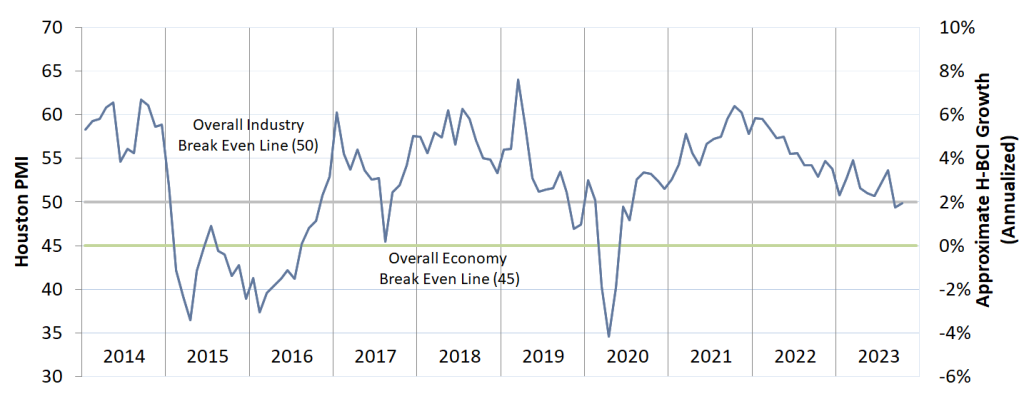
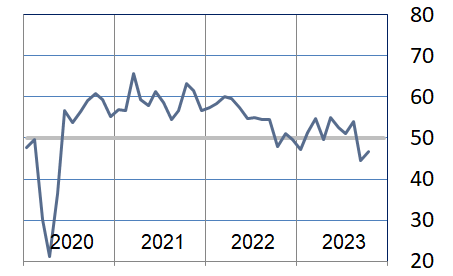
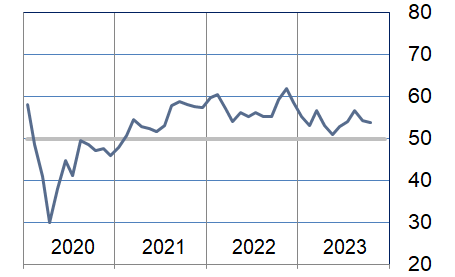
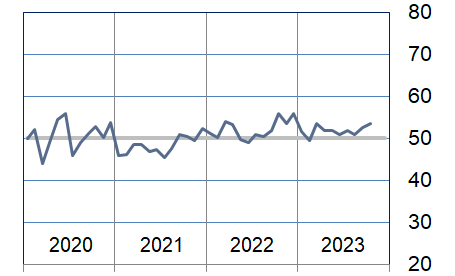
Houston PMI at 49.9 (up 0.5 points)
Sales/New Orders Contracting
Production Expanding
Employment Expanding
Prices Paid Expanding
Lead Times Contracting
Finished Goods Inventories Expanding
(Houston, Texas) – According to Houston area supply chain executives, the level of economic activity in Houston was relatively unchanged in October. Manufacturing reported contraction at a moderately faster pace and nonmanufacturing moved from minimal contraction to very slow expansion.
The Houston Purchasing Managers Index rose 0.5 points to 49.9. Two of the three of the underlying indicators that have the strongest positive correlation with the Houston economy (sales/new orders and lead times) continue to point to modest to strong contraction. The third indicator with a strong positive correlation to the economy (employment) continues to point to modest economic expansion. The sales/new orders index rose 2.0 points to 46.6. The employment index fell 0.5 points to 53.9. The lead times index rose 2.4 points to 49.5. The finished goods inventory index, the underlying indicator that has the strongest inverse correlation with economic activity, rose 4.2 points to 56.1, giving a stronger signal of potential economic contraction.
The Houston Manufacturing PMI fell 1.1 points to 45.9, providing a stronger indication of contraction in this sector. The nonmanufacturing PMI rose 0.9 points to 50.8, showing very slow expansion for the industries in this sector.
On an industry specific basis construction, professional and management services, oil & gas, and health care reported moderate expansion. All other sectors continue to report modest to strong contraction.
The Houston PMI provides a measure of current economic activity in the greater Houston area and a forecast of likely shifts in activity over a three-month forecast horizon. These indicators have a possible range of 0 to 100. Readings over 50 generally indicate goods producing industry expansion; readings below 50 show contraction. A PMI above 45 generally correlates with expansion of the Houston-The Woodlands-Sugar Land Business Cycle Index. The current and forecast PMI indices are based on diffusion indices for eight underlying indicators: Sales/New Orders, Production, Employment, Purchases, Prices Paid, Lead Times, Purchase Inventory, and Finished Goods Inventory.
Click here to see the PDF version of the full report.
Indices at a Glance
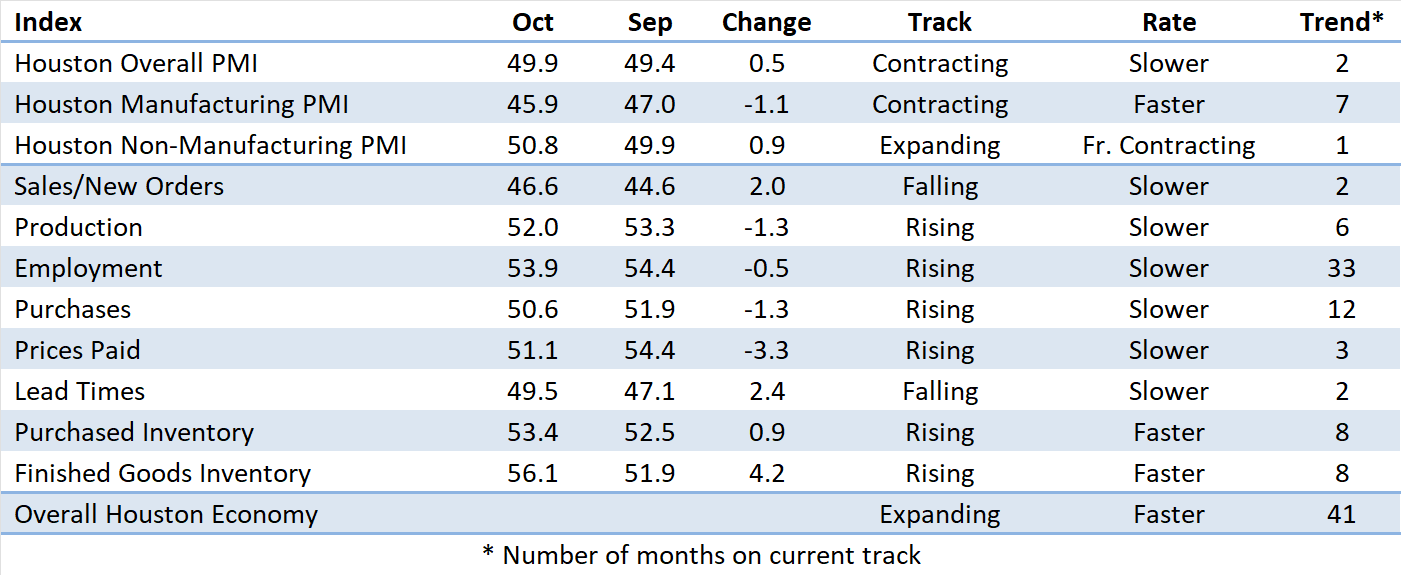
Houston PMI Trend
Houston PMI readings over 50 generally indicate that respondents see their activities as expanding. An HPMI above 45 normally correlates with expansion of the Houston-The Woodlands-Sugar Land Business Cycle Index (H-BCI).
Commodities Reported to have Notable Price Changes or to be in Short Supply
Up in Price: General labor, craft labor, contract labor; natural gas; propylene, elastomers, polypropylene polymers, oil field chemicals‡; compressors, electrical equipment, electronic components, electronic assemblies, automation electronics, nickel products‡, software.
Down in Price: Medical surgical supplies; hydraulic fracturing services (HHP), proppant, oil field chemicals‡; gasoline, jet fuel; ethane, propane, normal butane, natural gasoline, naphtha, industrial gasses (hydrogen, nitrogen and oxygen); palladium, nickel‡, molybdenum; stainless steel, alloy steel, steel pipe, carbon steel, lined pipe, fabricated structural steel, fabricated equipment, glass, lumber, gypsum; truck freight, ocean container freight.
In Short Supply: Fluoropolymers (PFAs); HVAC equipment, compressors, electrical steel, switchgear, transformers, relays, breakers, switches, electrical equipment, electronic components, electronic assemblies, automation electronics; certain types of marine vessels.
‡ reported as up or down by different respondents
What our Respondents are Saying
Oil and Gas Exploration, and Key Support Services:
- While U.S. and Texas rig counts continue to fall, crude production is rising.
- This sector’s performance recovered to showing modest expansion; the employment and purchases indices returned to just above neutral; the prices paid index fell to near neutral; lead times are increasing.
Construction:
- A shortage of experienced skilled labor and professional staff remains a challenge.
- Commodity prices have stabilized, and lead times continue to fall.
- Performance in this sector was relatively unchanged, continuing to show modest to strong growth; the employment index continues to show strength; prices paid have stabilized; lead times continue to fall.
Durable Goods Manufacturing:
- Steady increase in incoming sales orders due to ongoing demand for oil & gas products.
- Lead times and pricing have remained relatively stable over recent months although price inflation continues to remain an ongoing concern.
- Our efforts to near-shore our supplier base for some of our more critical inventory items have proven successful in recent months.
- This sector’s performance continues to show weakness; the production and purchases indices joined the sales/new orders index in reporting well below neutral; the inventory indices showed continued expansion at a rapid pace; the lead times index rose significantly above neutral.
Non-durable Goods Manufacturing:
- Softness continues in chemical processing market; headwinds from demand perspective to potentially continue in 4Q23 and 1Q24; longer term (2-3 year horizon) looks favorable from a demand cycle perspective.
- Investments in capital projects continue to support Net Zero Carbon efforts.
- Prices for materials and equipment are approaching a low point, indicating that the surge in prices observed in 2021-2022 has concluded, however, prices have stabilized at a higher level.
- The market outlook for the next 12 months mostly suggests deflation or moderate upward trends.
- Refinery rates are falling as we come out of the summer driving season.
- This sector’s performance fell below neutral during the month with the sales/new orders index joining the purchases index pointing to potential contraction; the inventory indices returned to being reported significantly above neutral, which also points to a greater potential for economic contraction.
Trade, Transportation, and Warehousing:
- Year to date Houston air passenger totals are just below 2019 levels.
- This sector’s performance recovered to just below neutral during the month; the sales/new orders and purchases indices improved significantly but remain well below neutral; the prices paid index continued to point to expansion; all other indices were reported near neutral.
Real-Estate Services:
- New and existing home listings slowed further.
- Apartment rental rates remain strong.
- This sector’s performance remained below neutral during the month; home sales reported modest weakness, industrial and retail real estate came in at neutral; office real estate continues to show significant weakness.
Professional and Business Services:
- Hiring of employees, consultants and temporary workers remained flat as the holiday season approaches.
- Companies across most industries are being very cautious about adding any labor cost as economic concerns continue.
- Many organizations are not expecting the annual uptick in hiring that often occurs before the start of the new year.
- Very stable market right now in the people business; our market remains unchanged for the past several months.
- Expectations that the price of oil being over $80/bbl would foster an increase in hiring has simply not materialized.
- We are entering the budget season for Houston Energy companies; we don’t anticipate any significant activity in hiring that would occur from now to year end.
- This sector reported modest expansion again this month with continued strength in the employment and purchases indices; the sales/new orders index was reported as contracting at a significant pace; the lead times index joined all other indices in reporting near neutral.
Health Care:
- We continue to see a shortage on specialized construction labor and had to push back the opening of several clinics due to labor availability in in the state.
- Even though we are in growth mode our, headcounts are flat in non-providers positions; support organizations like HR, Finance, and Supply Chain are held to flat headcounts; this will continue for 2024 and 2025 as we now are in the thick of government cutbacks on reimbursement rates.
- Non growing healthcare companies are looking at layoffs, especially non-diversified companies.
- This sector reported moderating growth during the month driven primarily by the employment index falling to near neutral; the sales/new orders and purchases indices showed continued strength; the lead times index continues to indicate potential contraction; the inventory indices continue to run extremely high.
Government:
- Construction materials continue to stay high.
- Motor vehicles are returning to reasonable cost.
- Majority of commodities are returning to normal supply conditions.
- Hiring qualified staff still an issue.
- This sector’s performance remained near neutral; the purchases and inventory indices joined all other indices in reporting near neutral.
Trend of Underlying Indicators
The Houston PMI is based on diffusion indices for eight underlying indicators. The net value of each indicator is simply the percentage of respondents who cite a positive shift from the previous month minus the percentage who cite a negative shift. The diffusion index is calculated based on the percent of respondents reporting higher results plus one-half of those responding the same with seasonal adjustments to the Sales/New Orders, Production, Employment, and Prices Paid indices based on an X13 ARIMA forecast. Values above 50 for Sales/New Orders, Production, Employment, Prices Paid, and Lead Times generally point towards expansion and values below 50 signal contraction. Note that the Prices Paid Index may not follow this trend late in an economic expansion. The Inventory measures have an inverse correlation at most forecast horizons, meaning that values below 50 point to expansion and values above point to contraction. The Purchases index is inversely correlated with economic activity at the three-month forecast horizon.
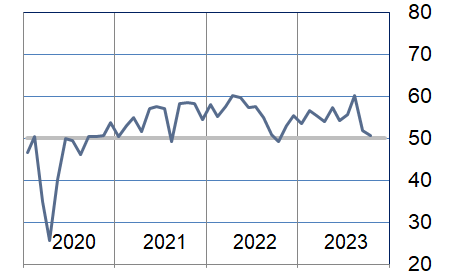
Sales/New Orders (Seasonally Adjusted)
The sales/new orders index continued to point to contraction at a rapid pace. While the nonmanufacturing sectors reported just below neutral, the manufacturing sectors reported well below this level.
| Higher | Same | Lower | Net | Index | |
| May/23 | 19% | 75% | 6% | 13% | 54.9 |
| Jun/23 | 11% | 80% | 9% | 2% | 52.9 |
| Jul/23 | 13% | 75% | 12% | 1% | 51.2 |
| Aug/23 | 16% | 78% | 6% | 10% | 54.0 |
| Sep/23 | 8% | 76% | 16% | -8% | 44.6 |
| Oct/23 | 5% | 79% | 16% | -11% | 46.6 |
Production Index (Seasonally Adjusted)
The production index fell minimally to indicate expansion at a slower pace with both manufacturing and nonmanufacturing respondents reporting very slow expansion.
| Higher | Same | Lower | Net | Index | |
| May/23 | 11% | 86% | 3% | 8% | 53.8 |
| Jun/23 | 11% | 83% | 6% | 5% | 54.0 |
| Jul/23 | 17% | 74% | 9% | 8% | 53.9 |
| Aug/23 | 12% | 85% | 3% | 9% | 54.5 |
| Sep/23 | 11% | 84% | 5% | 6% | 53.3 |
| Oct/23 | 8% | 87% | 5% | 3% | 52.0 |
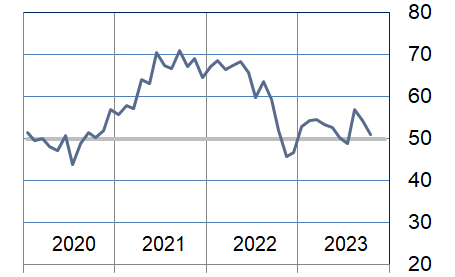
Employment Index (Seasonally Adjusted)
The employment index continues to show strong performance. Manufacturing returned to reporting modest expansion in this area. Nonmanufacturing reported well above this level.
| Higher | Same | Lower | Net | Index | |
| May/23 | 12% | 80% | 8% | 4% | 51.1 |
| Jun/23 | 15% | 80% | 5% | 10% | 53.0 |
| Jul/23 | 14% | 82% | 4% | 10% | 54.0 |
| Aug/23 | 13% | 82% | 5% | 8% | 56.8 |
| Sep/23 | 14% | 80% | 6% | 8% | 54.4 |
| Oct/23 | 7% | 91% | 2% | 5% | 53.9 |
Purchases Index (Not Seasonally Adjusted)
The purchases index fell again this month, but remained above neutral, lead by continued strength in the nonmanufacturing sectors. Manufacturing reported this index well below neutral.
| Higher | Same | Lower | Net | Index | |
| May/23 | 19% | 77% | 4% | 15% | 57.4 |
| Jun/23 | 14% | 80% | 6% | 8% | 54.3 |
| Jul/23 | 19% | 73% | 8% | 11% | 55.7 |
| Aug/23 | 27% | 67% | 6% | 21% | 60.2 |
| Sep/23 | 21% | 62% | 17% | 4% | 51.9 |
| Oct/23 | 16% | 69% | 15% | 1% | 50.6 |
Prices Paid Index (Seasonally Adjusted)
The prices paid index fell modestly to indicate slower price expansion. Nonmanufacturing continues to report strength in this index, while manufacturing prices paid are now contracting at a minimal level.
| Higher | Same | Lower | Net | Index | |
| May/23 | 13% | 78% | 9% | 4% | 52.6 |
| Jun/23 | 9% | 77% | 14% | -5% | 50.3 |
| Jul/23 | 8% | 82% | 10% | -2% | 48.9 |
| Aug/23 | 17% | 78% | 5% | 12% | 56.9 |
| Sep/23 | 12% | 85% | 3% | 9% | 54.4 |
| Oct/23 | 8% | 90% | 2% | 6% | 51.1 |
Lead Times Index (Not Seasonally Adjusted)
The lead times index rose to near neutral with increasing lead times being reported by manufacturing respondents and lower lead times reported by nonmanufacturing respondents.
| Higher | Same | Lower | Net | Index | |
| May/23 | 8% | 78% | 14% | -6% | 46.9 |
| Jun/23 | 5% | 80% | 15% | -10% | 45.0 |
| Jul/23 | 12% | 79% | 9% | 3% | 51.4 |
| Aug/23 | 9% | 83% | 8% | 1% | 50.5 |
| Sep/23 | 6% | 82% | 12% | -6% | 47.1 |
| Oct/23 | 6% | 87% | 7% | -1% | 49.5 |
Purchased Inventory Index (Not Seasonally Adjusted)
The purchased inventory index rose modestly during the month driven by significant increases in this index for the manufacturing sector. Nonmanufacturing sector performance remained just above neutral.
| Higher | Same | Lower | Net | Index | |
| May/23 | 8% | 88% | 4% | 4% | 51.9 |
| Jun/23 | 8% | 86% | 6% | 2% | 51.0 |
| Jul/23 | 8% | 88% | 4% | 4% | 52.0 |
| Aug/23 | 6% | 89% | 5% | 1% | 50.8 |
| Sep/23 | 10% | 85% | 5% | 5% | 52.5 |
| Oct/23 | 8% | 91% | 1% | 7% | 53.4 |
Finished Goods Inventory Index (Not Seasonally Adjusted)
The finished goods inventory index rose to well above neutral. This was also the result of a larger number of manufacturing sector respondents reporting these inventories as rising.
| Higher | Same | Lower | Net | Index | |
| May/23 | 9% | 88% | 3% | 6% | 53.0 |
| Jun/23 | 10% | 87% | 3% | 7% | 53.7 |
| Jul/23 | 9% | 86% | 5% | 4% | 52.1 |
| Aug/23 | 12% | 85% | 3% | 9% | 54.7 |
| Sep/23 | 9% | 86% | 5% | 4% | 51.9 |
| Oct/23 | 13% | 86% | 1% | 12% | 56.1 |
Background on the ISM-Houston Business Report and HPMI Calculation Methods
The Houston Purchasing Managers Index has been included as an integral part of the ISM-Houston Business Report since the Houston chapter of the Institute for Supply Management started publication of this document in January 1995. The report and index are published monthly as the primary deliverables from a survey of Houston area Supply Chain leaders regarding the status of key activities believed to provide insight into the strength of the economy. The respondents come from diverse organizations including construction, energy, engineering, health care, durable and non-durable goods manufacturing, financial and business services, wholesale and retail trade, and utilities related companies.
The Houston Purchasing Managers Index is determined from diffusion indices of the eight indicators of economic activity covered by the ISM-Houston Business Survey and Report. These underlying indicators are sales or new orders, production, employment, purchases, prices paid for major purchases, lead times from sellers, purchased materials inventory (raw materials and supplies), and finished goods inventories. The respondents to the survey report the direction of each these activities as either up, the same or down in comparison to the previous month. An index for each of these areas is then calculated by subtracting the percentage of respondents that sight a negative shift from the percentage that sight a positive shift. For indicators that are positively correlated with economic growth, this results in an underlying index that points to expansion when it is above zero. Indicators that are negatively correlated with growth point to expansion when they are below zero.
The final Houston PMI is calculated by applying optimal regression factors to each of the eight underlying indicators noted above. These regression factors are determined using standard regression techniques comparing these underlying indicators to the Houston-The Woodlands-Sugar Land Business Cycle Index (Houston BCI), which is reported on a monthly basis by the Federal Reserve Bank of Dallas. This top-level index is converted to a 0 to 100 scale to match that of the national Purchasing Managers Index® (PMI®) which is published monthly by the Institute for Supply Management® (ISM®). Readings over 50 for the HPMI generally indicate manufacturing expansion in the Houston in the near term and readings below 50 show coming manufacturing contraction.
It is important to note that the manufacturing breakeven HPMI does not equate to the breakeven point for the overall Houston economy. ISM-Houston periodically reviews the capability of its correlations and adjusts the regression factors when appropriate. The most recent revision occurred as a result of a review undertaken during the third quarter of 2018, which determined that changes in the Houston economy over the last decade have shifted the intercept of the correlation, causing a neutral Houston PMI to no longer align with a neutral Houston BCI. A Houston PMI of 45 points now equates to a neutral Houston economy as measured by the Houston BCI. A similar offset between the National PMI and the National economy has existed for some time.
Use of ISM-Houston Business Report Content
All information contained in this report is protected by copyright laws and ISM-Houston retains all rights to this Content. ISM-Houston hereby grants you a limited, revocable license to access, print, and display this Content solely for your personal, non-commercial use. Requests for permission to reproduce or redistribute ISM-Houston Business Report Content can be made by contacting the ISM-Houston Business Survey Committee at hpmi@ism-houston.org.
ISM-Houston shall not have any liability, duty, or obligation for or relating to the ISM-Houston Business Report Content or other information contained herein, any errors, inaccuracies, omissions or delays in providing any ISM-Houston Business Report Content, or for any actions taken in reliance thereon. In no event shall ISM-Houston be liable for any special, incidental, or consequential damages, arising out of the use of the ISM-Houston Business Report.