
For release December 11, 2023
November ISM-Houston Business Report
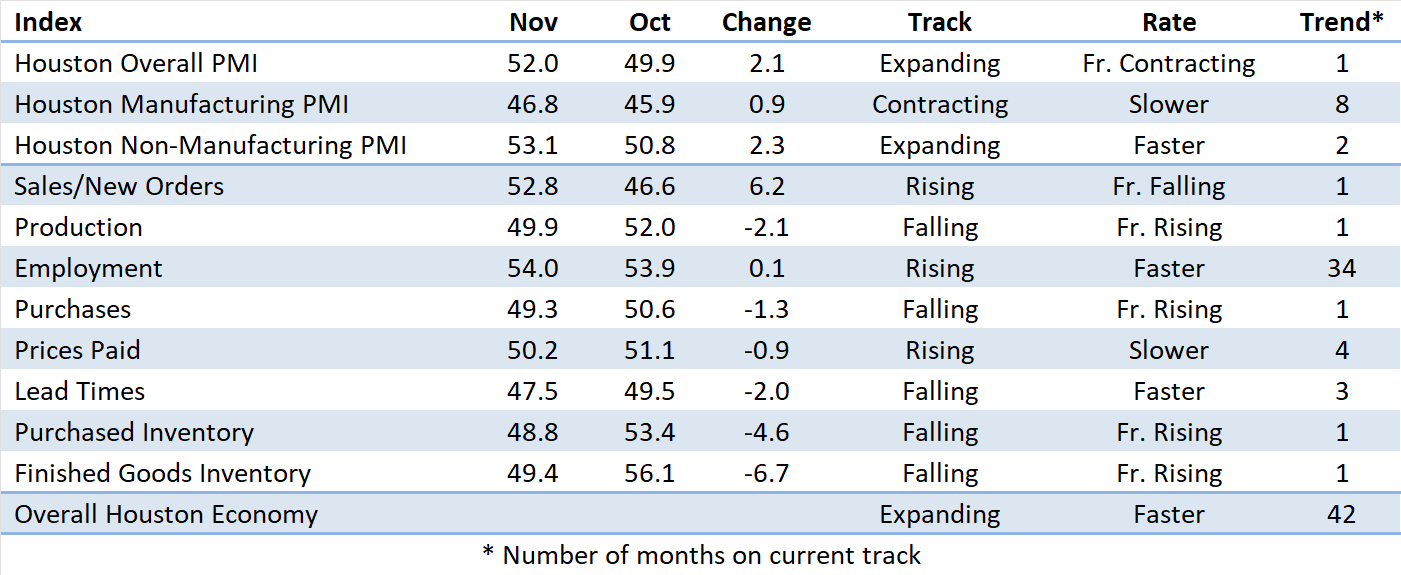
Houston PMI at 52.0 (up 2.1 points)
Sales/New Orders Expanding
Production Contracting
Employment Expanding
Prices Paid Expanding
Lead Times Contracting
Finished Goods Inventories Contracting
(Houston, Texas) – According to Houston area supply chain executives economic activity in Houston showed mixed results in November with the nonmanufacturing sectors expanding at a faster pace and the manufacturing sectors continuing to report weakness.
The Houston Purchasing Managers Index rose 2.1 points to 52.0. Two of the three of the underlying indicators that have the strongest positive correlation with the Houston economy (sales/new orders and employment) are now pointing to modest to strong expansion. The third indicator with a strong positive correlation to the economy (lead times) is giving a modest signal for contraction. The sales/new orders index rose a significant 6.2 points to 52.8. The employment index rose a minimal 0.1 points to 54.0. The lead times index fell 2.0 points to 47.5. The finished goods inventory index, the underlying indicator that has the strongest inverse correlation with economic activity, fell a significant 6.7 points to 49.4, giving a modest signal of economic expansion.
The Houston Manufacturing PMI rose 0.9 points to 46.8, providing a modestly weaker signal for contraction in this sector. The nonmanufacturing PMI rose 2.3 points to 53.1, showing a stronger indication of expansion for the industries in this sector.
On an industry specific basis construction, professional and management services, and oil & gas reported strong expansion Health care reported moderate expansion. Manufacturing reported significant weakness.
Click here to see the PDF version of the full report.
Indices at a Glance
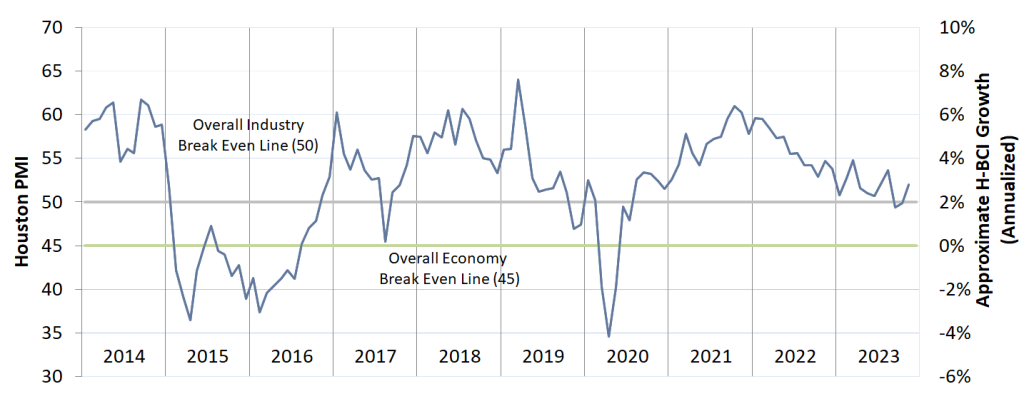
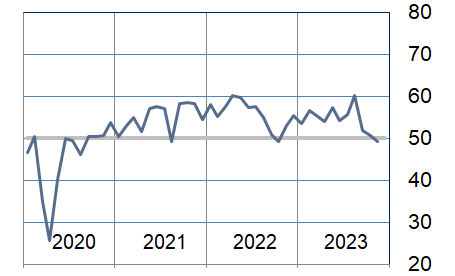
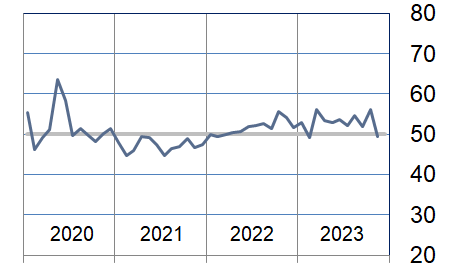
Houston PMI Trend
Houston PMI readings over 50 generally indicate that respondents see their activities as expanding. An HPMI above 45 normally correlates with expansion of the Houston-The Woodlands-Sugar Land Business Cycle Index (H-BCI).
Commodities Reported to have Notable Price Changes or to be in Short Supply
Up in Price: Rig Labor, craft labor, general labor, senior consultants, specialty chemicals, normal butane, isobutane, iron ore (62% FE), carbon steel‡, lumber, electrical gear, instrumentation, transformers, electronics, elastomers, ocean container freight.
Down in Price: Compressors, heat exchangers, fabricated equipment, electrical steel, steel pipe, carbon steel‡, stainless steel, OCTG Steel, MRO material, industrial gasses (hydrogen, nitrogen, oxygen), drums, totes, vessels.
In Short Supply: Rig Labor, Power suppliers, compressors, Fluoropolymers (PFAs), HVAC equipment, generators, transformers, electrical steel, instrumentation electronics, some electrical and automation equipment, specialty marine vessels
‡ reported as up or down by different respondents
What our Respondents are Saying
Oil and Gas Exploration, and Key Support Services:
- In general, pricing is flat in 4Q with slight projected pricing declines expected in 1H-24.
- Labor costs from service companies is up in order to attract and retain talent..
- This sector continues showing modest expansion; the production and employment indices accelerating well above neutral comparing to last month. The lead times and prices paid indices fell.
Construction:
- A shortage of experienced skilled labor and professional staff remains a challenge.
- Commodity prices have stabilized, and lead times continue to fall.
- This sector continues to show modest to strong growth; the employment index continues to show strength; sales saw a sharp increase which coincides with a sharp increase in the prices paid and purchases indices.
Durable Goods Manufacturing:
- New business remains extremely slow. Still concentrating on reducing inventory levels.
- Lead times and pricing have remained relatively stable over recent months although price inflation continues to remain an ongoing concern.
- Our efforts to near-shore our supplier base for some of our more critical inventory items have proven successful in recent months.
- This sector’s performance continues to show weakness as employment has now dipped below neutral. Finished goods inventory and purchased inventory have both contracted sharply this month as prices have also taken a sharp turn downward.
Non-durable Goods Manufacturing:
- Prices of our materials and equipment are approaching a low point, indicating that the surge in prices observed in 2021-2022 has concluded. However, prices have stabilized at a higher level.
- Demand outlook for suppliers is relatively weak for 2H24, but 1H24 will continue with strong backlog for manufacturers of equipment & commodity supplies.
- The market outlook for the next 12 months mostly suggests deflation or moderate upward trends.
- This sector’s performance improved to approaching neutral with finished goods inventory, purchased inventory, and production falling sharply into contracting. Employment saw a slight uptick remaining above neutral.
Professional and Business Services:
- Year-end budget cycles ending, we don’t anticipate any new wave of increase budgets for people.
- A much higher percentage of employees are staying put, not looking for new opportunities.
- Very stable market right now in the people business; our market remains unchanged for the past several months.
- This sector reported slightly greater expansion this month with continued strength in the employment and purchases indices; the sales/new orders index transitioned from contraction to significant expansion.
Health Care:
- Healthcare organizations have ramped up on test kits and surgical supplies in preparation for flu cases and a new variant of COVID-19 that is already plaguing the community.
- This sector reported moderating growth during the month with slowing in overall purchasing and reductions in inventories.
Government:
- Commodities supply is getting back to normal; still struggling with construction vendors due to the capacity compared to the demand.
- Commodities are coming back down to reasonable pricing.
- Fleet vehicles are returning to reasonable cost.
- Hiring qualified staff is still an issue.
- This sector’s performance remains near neutral.
Trend of Underlying Indicators
The Houston PMI is based on diffusion indices for eight underlying indicators. The net value of each indicator is simply the percentage of respondents who cite a positive shift from the previous month minus the percentage who cite a negative shift. The diffusion index is calculated based on the percent of respondents reporting higher results plus one-half of those responding the same with seasonal adjustments to the Sales/New Orders, Production, Employment, and Prices Paid indices based on an X13 ARIMA forecast. Values above 50 for Sales/New Orders, Production, Employment, Prices Paid, and Lead Times generally point towards expansion and values below 50 signal contraction. Note that the Prices Paid Index may not follow this trend late in an economic expansion. The Inventory measures have an inverse correlation at most forecast horizons, meaning that values below 50 point to expansion and values above point to contraction. The Purchases index is inversely correlated with economic activity at the three-month forecast horizon.
Sales/New Orders (Seasonally Adjusted)
The sales/new orders index rebounded, led by significant improvement in the nonmanufacturing sectors. Both durable goods and nondurable goods manufacturing continued to report significant weakness.
| Higher | Same | Lower | Net | Index | |
| Jun/23 | 11% | 80% | 9% | 2% | 52.9 |
| Jul/23 | 13% | 75% | 12% | 1% | 51.2 |
| Aug/23 | 16% | 78% | 6% | 10% | 54.0 |
| Sep/23 | 8% | 76% | 16% | -8% | 44.6 |
| Oct/23 | 5% | 79% | 16% | -11% | 46.6 |
| Nov/23 | 8% | 84% | 8% | 0% | 52.8 |
Production Index (Seasonally Adjusted)
The production index fell to just below neutral. Manufacturing reported significant weakness while nonmanufacturing improved modestly further above neutral.
| Higher | Same | Lower | Net | Index | |
| Jun/23 | 11% | 83% | 6% | 5% | 54.0 |
| Jul/23 | 17% | 74% | 9% | 8% | 53.9 |
| Aug/23 | 12% | 85% | 3% | 9% | 54.5 |
| Sep/23 | 11% | 84% | 5% | 6% | 53.3 |
| Oct/23 | 8% | 87% | 5% | 3% | 52.0 |
| Nov/23 | 5% | 88% | 7% | -2% | 49.9 |
Employment Index (Seasonally Adjusted)
The employment index continues to show strength led by continued expansion in the nonmanufacturing sectors. Manufacturing returned to reporting modest contraction in this index.
| Higher | Same | Lower | Net | Index | |
| Jun/23 | 15% | 80% | 5% | 10% | 53.0 |
| Jul/23 | 14% | 82% | 4% | 10% | 54.0 |
| Aug/23 | 13% | 82% | 5% | 8% | 56.8 |
| Sep/23 | 14% | 80% | 6% | 8% | 54.4 |
| Oct/23 | 7% | 91% | 2% | 5% | 53.9 |
| Nov/23 | 5% | 92% | 3% | 2% | 54.0 |

Purchases Index (Not Seasonally Adjusted)
The purchases index fell just below neutral this month. Modest strengthening in nonmanufacturing sectors was offset by significant weakness in manufacturing.
| Higher | Same | Lower | Net | Index | |
| Jun/23 | 14% | 80% | 6% | 8% | 54.3 |
| Jul/23 | 19% | 73% | 8% | 11% | 55.7 |
| Aug/23 | 27% | 67% | 6% | 21% | 60.2 |
| Sep/23 | 21% | 62% | 17% | 4% | 51.9 |
| Oct/23 | 16% | 69% | 15% | 1% | 50.6 |
| Nov/23 | 7% | 84% | 9% | -2% | 49.3 |
Prices Paid Index (Seasonally Adjusted)
The prices paid index fell to near neutral. Nonmanufacturing remained just above this level while manufacturing moved to show additional weakness in this index.
| Higher | Same | Lower | Net | Index | |
| Jun/23 | 9% | 77% | 14% | -5% | 50.3 |
| Jul/23 | 8% | 82% | 10% | -2% | 48.9 |
| Aug/23 | 17% | 78% | 5% | 12% | 56.9 |
| Sep/23 | 12% | 85% | 3% | 9% | 54.4 |
| Oct/23 | 8% | 90% | 2% | 6% | 51.1 |
| Nov/23 | 3% | 92% | 5% | -2% | 50.2 |
Lead Times Index (Not Seasonally Adjusted)
The lead times index fell further below neutral with lower lead times reported by both manufacturing and nonmanufacturing respondents
| Higher | Same | Lower | Net | Index | |
| Jun/23 | 5% | 80% | 15% | -10% | 45.0 |
| Jul/23 | 12% | 79% | 9% | 3% | 51.4 |
| Aug/23 | 9% | 83% | 8% | 1% | 50.5 |
| Sep/23 | 6% | 82% | 12% | -6% | 47.1 |
| Oct/23 | 6% | 87% | 7% | -1% | 49.5 |
| Nov/23 | 4% | 87% | 9% | -5% | 47.5 |
Purchased Inventory Index (Not Seasonally Adjusted)
The purchased inventory index fell below neutral during the month, led by significant reductions in this index for in the manufacturing sectors. Nonmanufacturing performance remained just above neutral.
| Higher | Same | Lower | Net | Index | |
| Jun/23 | 8% | 86% | 6% | 2% | 51.0 |
| Jul/23 | 8% | 88% | 4% | 4% | 52.0 |
| Aug/23 | 6% | 89% | 5% | 1% | 50.8 |
| Sep/23 | 10% | 85% | 5% | 5% | 52.5 |
| Oct/23 | 8% | 91% | 1% | 7% | 53.4 |
| Nov/23 | 3% | 91% | 6% | -3% | 48.8 |
Finished Goods Inventory Index (Not Seasonally Adjusted)
The finished goods inventory index rose to well above neutral. This was also the result of a larger number of manufacturing sector respondents reporting these inventories as rising.
| Higher | Same | Lower | Net | Index | |
| Jun/23 | 10% | 87% | 3% | 7% | 53.7 |
| Jul/23 | 9% | 86% | 5% | 4% | 52.1 |
| Aug/23 | 12% | 85% | 3% | 9% | 54.7 |
| Sep/23 | 9% | 86% | 5% | 4% | 51.9 |
| Oct/23 | 13% | 86% | 1% | 12% | 56.1 |
| Nov/23 | 5% | 89% | 6% | -1% | 49.4 |
Background on the ISM-Houston Business Report and HPMI Calculation Methods
The Houston Purchasing Managers Index has been included as an integral part of the ISM-Houston Business Report since the Houston chapter of the Institute for Supply Management started publication of this document in January 1995. The report and index are published monthly as the primary deliverables from a survey of Houston area Supply Chain leaders regarding the status of key activities believed to provide insight into the strength of the economy. The respondents come from diverse organizations including construction, energy, engineering, health care, durable and non-durable goods manufacturing, financial and business services, wholesale and retail trade, and utilities related companies.
The Houston Purchasing Managers Index is determined from diffusion indices of the eight indicators of economic activity covered by the ISM-Houston Business Survey and Report. These underlying indicators are sales or new orders, production, employment, purchases, prices paid for major purchases, lead times from sellers, purchased materials inventory (raw materials and supplies), and finished goods inventories. The respondents to the survey report the direction of each these activities as either up, the same or down in comparison to the previous month. An index for each of these areas is then calculated by subtracting the percentage of respondents that sight a negative shift from the percentage that sight a positive shift. For indicators that are positively correlated with economic growth, this results in an underlying index that points to expansion when it is above zero. Indicators that are negatively correlated with growth point to expansion when they are below zero.
The final Houston PMI is calculated by applying optimal regression factors to each of the eight underlying indicators noted above. These regression factors are determined using standard regression techniques comparing these underlying indicators to the Houston-The Woodlands-Sugar Land Business Cycle Index (Houston BCI), which is reported on a monthly basis by the Federal Reserve Bank of Dallas. This top-level index is converted to a 0 to 100 scale to match that of the national Purchasing Managers Index® (PMI®) which is published monthly by the Institute for Supply Management® (ISM®). Readings over 50 for the HPMI generally indicate manufacturing expansion in the Houston in the near term and readings below 50 show coming manufacturing contraction.
It is important to note that the manufacturing breakeven HPMI does not equate to the breakeven point for the overall Houston economy. ISM-Houston periodically reviews the capability of its correlations and adjusts the regression factors when appropriate. The most recent revision occurred as a result of a review undertaken during the third quarter of 2018, which determined that changes in the Houston economy over the last decade have shifted the intercept of the correlation, causing a neutral Houston PMI to no longer align with a neutral Houston BCI. A Houston PMI of 45 points now equates to a neutral Houston economy as measured by the Houston BCI. A similar offset between the National PMI and the National economy has existed for some time.
Use of ISM-Houston Business Report Content
All information contained in this report is protected by copyright laws and ISM-Houston retains all rights to this Content. ISM-Houston hereby grants you a limited, revocable license to access, print, and display this Content solely for your personal, non-commercial use. Requests for permission to reproduce or redistribute ISM-Houston Business Report Content can be made by contacting the ISM-Houston Business Survey Committee at hpmi@ism-houston.org.
ISM-Houston shall not have any liability, duty, or obligation for or relating to the ISM-Houston Business Report Content or other information contained herein, any errors, inaccuracies, omissions or delays in providing any ISM-Houston Business Report Content, or for any actions taken in reliance thereon. In no event shall ISM-Houston be liable for any special, incidental, or consequential damages, arising out of the use of the ISM-Houston Business Report.