
For release December 12, 2022
November 2022 ISM-Houston Business Report
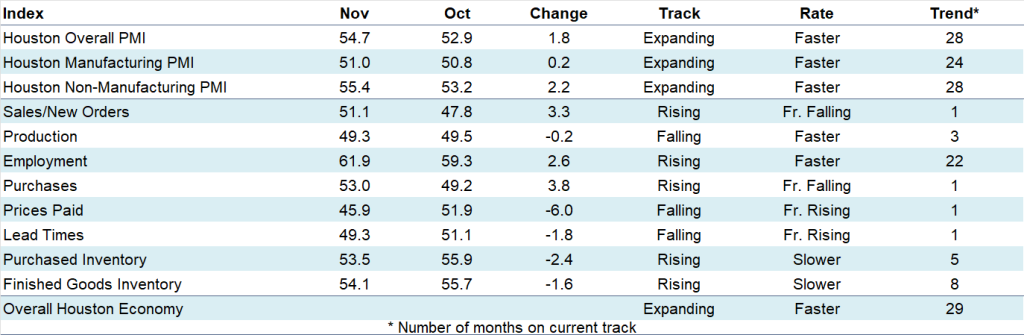
Houston PMI at 54.7 (up 1.8 points)
Sales/New Orders Expanding
Employment Expanding
Prices Paid Contracting
Lead Times Contracting
Finished Goods Inventories Expanding
(Houston, Texas) – According to Houston area supply chain executives, economic activity in Houston expanded at a somewhat higher pace in November. Manufacturing sector activity was relatively unchanged while non-manufacturing activity showed modestly higher expansion.
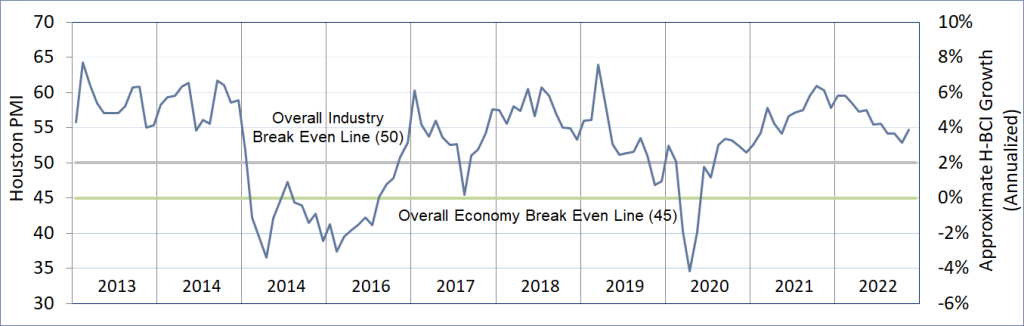
The Houston Purchasing Managers Index rose 1.8 points to 54.7. Two of the three underlying indicators that have the strongest correlation with the Houston economy, sales/new orders and employment, rose indicating stronger expansion. The third, lead times, fell below neutral indicating a potential for economic contraction. The sales/new orders index rose 3.3 points to 51.1. The employment index rose 2.6 points to 61.9. The lead times index fell 1.8 points to 49.3. The Finished goods inventory index, the underlying indicator that has the strongest inverse correlation with economic activity, fell 1.6 points to 54.1, giving a modestly lower indication of contraction.
The Houston Manufacturing PMI rose 0.2 points to 51.1, continuing to point to very modest expansion. Note that improvements to the employment and lead times indices for this sector offset significant weakness in the sales/new orders index. The non-manufacturing PMI rose 2.2 points to 55.4, showing a higher expansion rate for the industries in this sector.
On an industry specific basis, health care, leisure and hospitality, professional and management services, oil & gas, and construction reported continued expansion. Manufacturing, and trade, transportation & warehousing reported near neutral. Real estate reported significant contraction.
The Houston PMI provides a measure of current economic activity in the greater Houston area and a forecast of likely shifts in activity over a three-month forecast horizon. These indicators have a possible range of 0 to 100. Readings over 50 generally indicate goods producing industry expansion; readings below 50 show contraction. A PMI above 45 generally correlates with expansion of the Houston-The Woodlands-Sugar Land Business Cycle Index. The current and forecast PMI indices are based on diffusion indices for eight underlying indicators: Sales/New Orders, Production, Employment, Purchases, Prices Paid, Lead Times, Purchase Inventory, and Finished Goods Inventory.
Click here to see the PDF version of the full report.
Indices at a Glance
Houston PMI Trend
Houston PMI readings over 50 generally indicate that respondents see their activities as expanding. An HPMI above 45 normally correlates with expansion of the Houston-The Woodlands-Sugar Land Business Cycle Index (H-BCI).
Commodities Reported to have Notable Price Changes or to be in Short Supply
Up in Price: Temporary labor; energy; MRI equipment; oil country tubular goods (OCTG), offshore drilling rigs; elastomers, liquid caustic soda‡; gold, silver, platinum, aluminum‡, copper‡, nickel, molybdenum, iron ore; cement/concrete products, transformers, switchgear, HVAC, furniture; marine vessels
Down in Price: Crude oil, gasoline, diesel, jet fuel, natural gas, ethane, propane, butanes, natural gasoline, ethylene, propylene, methanol, n-butanol, 2-ethylhexanol, glycols, ethylene dichloride, ammonia, caustic soda‡, polyethylene, polypropylene; carbon steel, aluminum‡, copper‡, lumber; ocean bulk and container freight
In Short Supply: Finance, accounting, IT, and senior consulting professionals; light industrial labor; lab supplies, sterile water, certain drugs used for anesthesia; diethylene glycol, fluoropolymers; fracking sand, oil country tubular goods (OCTG), offshore fabrication yard capacity, certain classes of offshore rigs; cement, some mechanical components, pump and compressor components; computers and associated hardware, semiconductors, electrical components, power supplies, variable frequency drives
‡ reported as up or down by different respondents
What our Respondents are Saying
Oil and Gas Exploration, and Key Support Services:
- Potential rail strike on December 9th will impair logistics of sand and pipe to drilling and completion operations
- Rig counts continue to rise at a very slow rate
- This sector reported a similar level of growth to last month with the production, employment, purchases, and prices paid indices again showing significant strength
Construction:
- Performance in this sector rose to above neutral led by strength in the employment and purchases indices. The sales/new orders, prices paid, and lead times indices continue to point to modest contraction
Durable Goods Manufacturing:
- This sector moved back to expansion this month with the sales/new orders, purchases, prices paid, and lead times indices showing strength; inventories are now too high
Non-durable Goods Manufacturing:
- Market demand is slowing, causing growing finished product inventories which are resulting in reduced raw material purchases and production rates
- Our gulf coast refinery utilization is extremely high
- Olefins prices were relatively stable during the month, but have fallen significantly in early December
- We are seeing demand contraction
- Continued softening in demand in the USA
- Supplier Fabrication shops have a high backlog
- This sector weakened to below neutral with the sales/new orders, production, purchases, and prices paid indices coming in well below neutral; the employment and lead times indices remained strong
Trade, Transportation, and Warehousing:
- Stable for now
- This sector reported expansion at a slow pace; the sales/new orders index improved to above neutral, joining the employment index showing strength; the purchases, prices paid, and lead times indices remained below neutral
Real-Estate Services:
- New and existing homes sales continue to slow
- This sector fell further below neutral with purchases index joining the sales/new orders, prices paid, and lead times indices well below neutral; all other indices reported near neutral; industrial real-estate reported continued expansion; apartments fell to near neutral; housing contracted at a rapid pace
Leisure and Hospitality:
- This sector reported strength during the month with the sales/new orders, employment, and prices paid indices showing expansion at a good pace
Professional and Business Services:
- Our business lines across all industries are all trending upward at the same time
- The strain on the global supply chain could be substantial for the long term
- The market for people has stabilized; there are no significant shortages and no over supply of talent
- Alternative energy companies are seeking candidates to fill positions and we anticipate that this will continue
- The hourly and direct hire salary increases seen over that last year appear to have stabilized
- The Holidays and recession fears are slowing hiring in many industry sectors and across multiple disciplines
- Still high demand for light industrial workers but demand continues to outpace supply of talent
- Capital spending decreasing; most companies taking a wait and see approach to 2023.
- This sector continued to expand at a higher rate driven by a further increase in the employment index and a modest increase in the sales/new orders index
Health Care:
- We are not seeing any slowdown and are aggressively expanding with the intent to double our size within five years
- We are experiencing the same supply chain issues as everyone else
- This sector improved further during the month with significant strength reported for all indices
Trend of Underlying Indicators
The Houston PMI is based on diffusion indices for eight underlying indicators. The net value of each indicator is simply the percentage of respondents who cite a positive shift from the previous month minus the percentage who cite a negative shift. The diffusion index is calculated based on the percent of respondents reporting higher results plus one-half of those responding the same with a seasonal adjustment based on an X13 ARIMA forecast. Values above 50 for Sales/New Orders, Production, Employment, Prices Paid, and Lead Times generally point towards expansion and values below 50 signal contraction. Note that the Prices Paid Index may not follow this trend late in an economic expansion. The Inventory measures have an inverse correlation at most forecast horizons, meaning that values below 50 point to expansion and values above point to contraction. The Purchases index is inversely correlated with economic activity at the three-month forecast horizon.
Sales/New Orders
The sales/new orders index rose back above neutral led by significant improvements in nonmanufacturing sectors. Manufacturing remained well below neutral for this index.
| Higher | Same | Lower | Net | Index | |
| Jun/22 | 14% | 82% | 4% | 10% | 54.8 |
| Jul/22 | 15% | 81% | 4% | 11% | 55.0 |
| Aug/22 | 14% | 82% | 4% | 10% | 54.6 |
| Sep/22 | 17% | 75% | 8% | 9% | 54.4 |
| Oct/22 | 6% | 81% | 13% | -7% | 47.8 |
| Nov/22 | 14% | 70% | 16% | -2% | 51.1 |
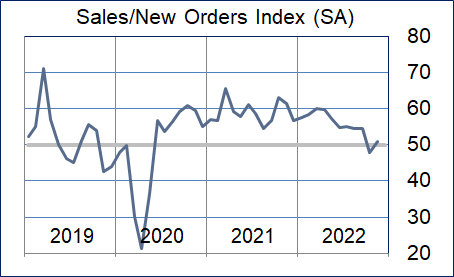
Production Index
The production index was relatively flat with manufacturing activities reporting below neutral and nonmanufacturing reporting at neutral.
| Higher | Same | Lower | Net | Index | |
| Jun/22 | 7% | 91% | 2% | 5% | 52.0 |
| Jul/22 | 13% | 84% | 3% | 10% | 55.1 |
| Aug/22 | 10% | 85% | 5% | 5% | 52.5 |
| Sep/22 | 6% | 85% | 9% | -3% | 48.6 |
| Oct/22 | 7% | 85% | 8% | -1% | 49.5 |
| Nov/22 | 8% | 82% | 10% | -2% | 49.3 |
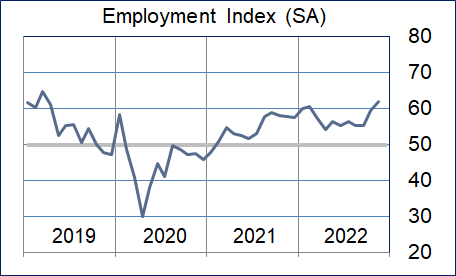
Employment Index
The employment index rose further with oil & gas, construction, nondurable goods manufacturing, healthcare, transportation and trade, and professional services reporting strength.
| Jun/22 | 15% | 84% | 1% | 14% | 55.3 |
| Jul/22 | 15% | 83% | 2% | 13% | 56.3 |
| Aug/22 | 14% | 84% | 2% | 12% | 55.4 |
| Sep/22 | 15% | 83% | 2% | 13% | 55.4 |
| Oct/22 | 20% | 78% | 2% | 18% | 59.3 |
| Nov/22 | 23% | 74% | 3% | 20% | 61.9 |
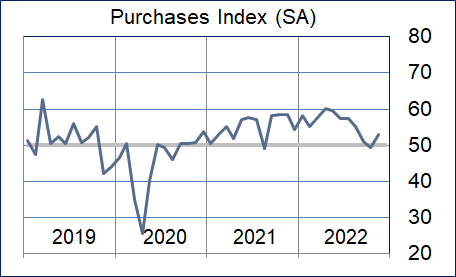
Purchases Index
The purchases index rose back above neutral. Durable goods joined oil & gas, construction, professional services, and health care reporting strength. Wholesale trade and nondurable goods reported weakness.
| Jun/22 | 19% | 79% | 2% | 17% | 57.4 |
| Jul/22 | 17% | 79% | 4% | 13% | 57.5 |
| Aug/22 | 19% | 74% | 7% | 12% | 55.1 |
| Sep/22 | 11% | 84% | 5% | 6% | 51.0 |
| Oct/22 | 8% | 81% | 11% | -3% | 49.2 |
| Nov/22 | 14% | 77% | 9% | 5% | 53.0 |
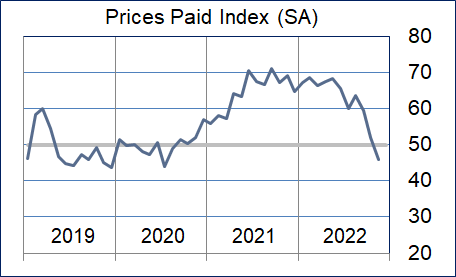
Prices Paid Index
The prices paid index fell below neutral. O&G, durable goods, health care, and leisure & hospitality reported expansion. Construction, nondurable goods, and wholesale trade reported contraction.
| Higher | Same | Lower | Net | Index | |
| Jun/22 | 33% | 65% | 2% | 31% | 65.7 |
| Jul/22 | 24% | 69% | 7% | 17% | 60.0 |
| Aug/22 | 29% | 67% | 4% | 25% | 63.6 |
| Sep/22 | 21% | 76% | 3% | 18% | 59.4 |
| Oct/22 | 16% | 72% | 12% | 4% | 51.9 |
| Nov/22 | 12% | 67% | 21% | -9% | 45.9 |
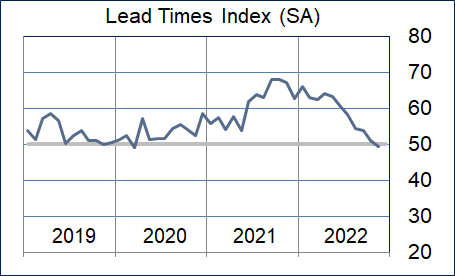
Lead Times Index
The lead times index fell to just below neutral. Only manufacturing and healthcare reported this index as expanding. Construction, transportation and trade, and real estate reported is as contracting.
| Jun/22 | 26% | 70% | 4% | 22% | 60.4 |
| Jul/22 | 22% | 73% | 5% | 17% | 58.3 |
| Aug/22 | 17% | 76% | 7% | 10% | 54.4 |
| Sep/22 | 15% | 77% | 8% | 7% | 53.8 |
| Oct/22 | 10% | 80% | 10% | 0% | 51.1 |
| Nov/22 | 9% | 80% | 11% | -2% | 49.3 |
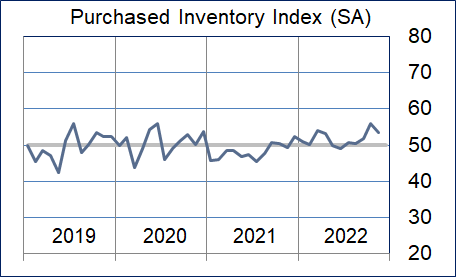
Purchased Inventory Index
The purchased inventories index showed expansion for the fifth month with durable goods joining health care reporting significant increases. Construction reported these inventories as contracting.
| Higher | Same | Lower | Net | Index | |
| Jun/22 | 7% | 86% | 7% | 0% | 49.1 |
| Jul/22 | 9% | 85% | 6% | 3% | 50.8 |
| Aug/22 | 9% | 84% | 7% | 2% | 50.4 |
| Sep/22 | 6% | 88% | 6% | 0% | 51.9 |
| Oct/22 | 8% | 88% | 4% | 4% | 55.9 |
| Nov/22 | 9% | 86% | 5% | 4% | 53.5 |
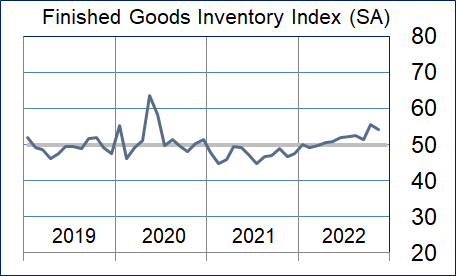
Finished Goods Inventory Index
The finished goods inventory index rose. Durable goods reported this index as expanding at a rapid pace. All other sectors that report these inventories came in near neutral.
| Higher | Same | Lower | Net | Index | |
| Jun/22 | 5% | 92% | 3% | 2% | 51.9 |
| Jul/22 | 8% | 88% | 4% | 4% | 52.1 |
| Aug/22 | 9% | 86% | 5% | 4% | 52.6 |
| Sep/22 | 7% | 87% | 6% | 1% | 51.4 |
| Oct/22 | 11% | 81% | 8% | 3% | 55.7 |
| Nov/22 | 14% | 82% | 4% | 10% | 54.1 |
Background on the ISM-Houston Business Report and HPMI Calculation Methods
The Houston Purchasing Managers Index has been included as an integral part of the ISM-Houston Business Report since the Houston chapter of the Institute for Supply Management started publication of this document in January 1995. The report and index are published monthly as the primary deliverables from a survey of Houston area Supply Chain leaders regarding the status of key activities believed to provide insight into the strength of the economy. The respondents come from diverse organizations including construction, energy, engineering, health care, durable and non-durable goods manufacturing, financial and business services, wholesale and retail trade, and utilities related companies.
The Houston Purchasing Managers Index is determined from diffusion indices of the eight indicators of economic activity covered by the ISM-Houston Business Survey and Report. These underlying indicators are sales or new orders, production, employment, purchases, prices paid for major purchases, lead times from sellers, purchased materials inventory (raw materials and supplies), and finished goods inventories. The respondents to the survey report the direction of each these activities as either up, the same or down in comparison to the previous month. An index for each of these areas is then calculated by subtracting the percentage of respondents that sight a negative shift from the percentage that sight a positive shift. For indicators that are positively correlated with economic growth, this results in an underlying index that points to expansion when it is above zero. Indicators that are negatively correlated with growth point to expansion when they are below zero.
The final Houston PMI is calculated by applying optimal regression factors to each of the eight underlying indicators noted above. These regression factors are determined using standard regression techniques comparing these underlying indicators to the Houston-The Woodlands-Sugar Land Business Cycle Index (Houston BCI), which is reported on a monthly basis by the Federal Reserve Bank of Dallas. This top-level index is converted to a 0 to 100 scale to match that of the national Purchasing Managers Index® (PMI®) which is published monthly by the Institute for Supply Management® (ISM®). Readings over 50 for the HPMI generally indicate manufacturing expansion in the Houston in the near term and readings below 50 show coming manufacturing contraction.
It is important to note that the manufacturing breakeven HPMI does not equate to the breakeven point for the overall Houston economy. ISM-Houston periodically reviews the capability of its correlations and adjusts the regression factors when appropriate. The most recent revision occurred as a result of a review undertaken during the third quarter of 2018, which determined that changes in the Houston economy over the last decade have shifted the intercept of the correlation, causing a neutral Houston PMI to no longer align with a neutral Houston BCI. A Houston PMI of 45 points now equates to a neutral Houston economy as measured by the Houston BCI. A similar offset between the National PMI and the National economy has existed for some time.
Use of ISM-Houston Business Report Content
All information contained in this report is protected by copyright laws and ISM-Houston retains all rights to this Content. ISM-Houston hereby grants you a limited, revocable license to access, print, and display this Content solely for your personal, non-commercial use. Requests for permission to reproduce or redistribute ISM-Houston Business Report Content can be made by contacting the ISM-Houston Business Survey Committee at hpmi@ism-houston.org.
ISM-Houston shall not have any liability, duty, or obligation for or relating to the ISM-Houston Business Report Content or other information contained herein, any errors, inaccuracies, omissions or delays in providing any ISM-Houston Business Report Content, or for any actions taken in reliance thereon. In no event shall ISM-Houston be liable for any special, incidental, or consequential damages, arising out of the use of the ISM-Houston Business Report.