Houston PMI at 51.0 (down 0.4 points)
Sales/New Orders Expanding
Production Contracting
Employment Expanding
Prices Paid Expanding
Lead Times Expanding
Finished Goods Inventories Contracting
Analysis by Murali Rajagopalachari and report by Ross Harvison
(Houston, Texas) – According to Houston area supply chain executives the Houston economy expanded again in May. The manufacturing sector expanded for the fifth month, and non-manufacturing expanded for the fourth month. The overall Houston economy expanded for the 72nd month in a row.
The Houston Purchasing Managers Index fell 0.4 points to 51.0, indicating continued modest growth in the overall economy. All three of the underlying indicators that have a strong direct correlation with economic activity (sales/new orders, employment, and lead times) are pointing to very modest growth. The sales/new orders index fell 2.3 points to 51.2 points, the employment index rose 0.2 points to 50.9, and the lead times index rose 0.3 points to 51.3 points. The finished goods inventory index, the underlying indicator that has the strongest inverse correlation with economic activity, fell 1.8 points to 48.2, pointing to modest economic expansion.
The Houston Manufacturing PMI fell 2.2 points during the month to 50.0 points. Durable goods manufacturing continued to report weakness, while non-durable goods reported strength. The non-manufacturing PMI fell 0.1 points to 51.1, indicating modest weakening from last month.
On an industry specific basis construction, professional services, nondurable goods manufacturing, and trade/transportation/warehousing reported strong expansion. Oil and gas extraction and durable goods manufacturing continue to report weakness.
Please click here to go to the hardcopy version of the report.
Houston PMI Trend
Indices at a Glance
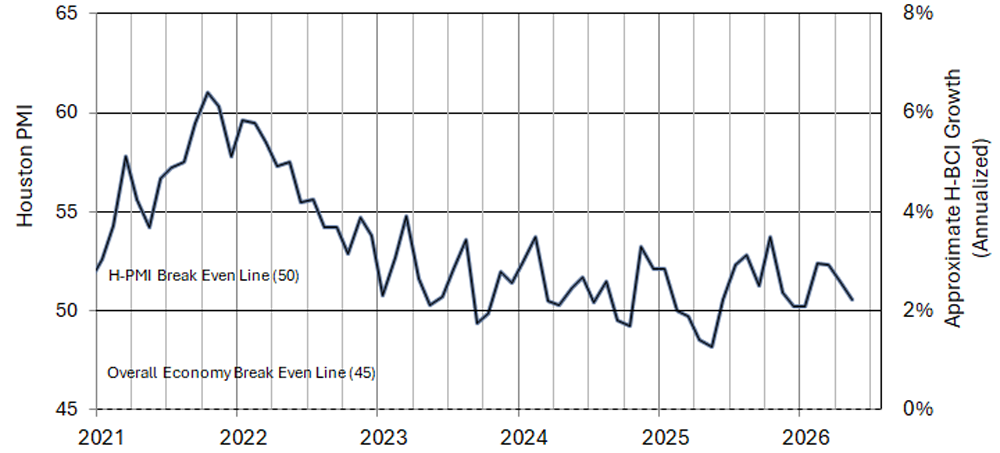
Houston PMI readings over fifty indicate that respondents see their activities as expanding. An H-PMI above 45 normally correlates with expansion of the Houston-The Woodlands-Sugar Land Business Cycle Index.
| Index | May | Apr | Change | Track | Rate | Trend* |
| Houston Overall PMI | 51.0 | 51.4 | -0.4 | Expanding | Slower | 12 |
| Houston Manufacturing PMI | 50.0 | 52.2 | -2.2 | Neutral | Fr. Exp. | 5 |
| Houston Non-Manufacturing PMI | 51.2 | 51.3 | -0.1 | Expanding | Slower | 4 |
| Sales/New Orders | 51.2 | 53.5 | -2.3 | Expanding | Slower | 5 |
| Production | 48.9 | 50.4 | -1.5 | Contracting | Fr. Exp. | 1 |
| Employment | 50.9 | 50.7 | 0.2 | Expanding | Faster | 4 |
| Purchases | 55.1 | 53.8 | 1.3 | Expanding | Faster | 29 |
| Prices Paid | 65.1 | 64.3 | 0.8 | Expanding | Faster | 8 |
| Lead Times | 51.3 | 51.0 | 0.3 | Expanding | Faster | 6 |
| Purchased Inventory | 48.1 | 49.2 | -1.1 | Contracting | Faster | 3 |
| Finished Goods Inventory | 49.7 | 51.3 | -1.6 | Contracting | Fr. Exp. | 1 |
| Overall Houston Economy | Expanding | Slower | 72 | |||
| * Number of months on current track | ||||||
Commodities Reported to be Up/Down in Price or in Short Supply
Up in Price: Natural gas, motor fuels (gasoline, diesel); oil field chemicals, chemicals, additives, petrochemical feedstocks (natural gas liquids, propane, normal butane, isobutane), polymer films, plastics, resins, plastic fine wire; power generation equipment, electrical supplies, electrical gear, electronic components; steel products, copper, aluminum, nickel‡, carbon steel‡; isotainers, motor freight, breakbulk ocean freight, ocean container freight.
Down in Price: Crude oil; propylene, polyethylene, tape; carbon steel‡, nickel‡, tungsten, platinum, rhodium.
In Short Supply: I&E craft labor; petrochemical feedstocks, peroxides, polyfluoroalkyls (PFA), chemical additives, oil field chemicals, plastic fine wire, large raised face weld neck flanges; power generation equipment, transformers, electronic components, electronics, memory chips, electrical supplies, automation equipment, electrical equipment, instrumentation; isotainers, breakbulk vessels.
‡ Noted as being up or down by different respondents.
What Our Respondents Are Saying:
Oil and Gas Exploration, and Key Support Services:
- We continue to expect higher fuel and associated costs.
- New tariffs continue to be a concern.
- This sector reported contraction again this month. The sales, production, employment, purchases, lead times, and inventory indices all showed weakness. Only the prices paid index is pointing to expansion.
Construction:
- Gasoline and diesel prices fall significantly in late May, consistent with falling crude prices.
- The International Monetary Fund (IMF) projects global inflation to rise from 4.1% in 2025 to 4.5% in 2026.
- Lumber prices have remained stable for the last several months
- This sector continues to experience strong expansion. The sales/new orders, employment, purchases, prices paid, and lead times indices are all showing significant strength.
Durable Goods Manufacturing:
- This sector showed weakness for the third month. The sales/new orders, production, employment, purchases, lead times, and inventory indices are all pointing to contraction. Only the prices paid index showed strength.
Non-durable Goods Manufacturing:
- Except for ethane, cracker feedstock prices rose again in May.
- Olefin’s prices started falling in late May.
- Precious metals prices started fall in early June.
- Tariffs and global conflict disruptions continue to be a major focus.
- We are seeing the impact of the supply constraints caused by the Middle East conflict. We are keeping several months of inventory on critical materials to minimize the effect on our operations as vessels are taking two months to get between regions. Unfortunately, our normal schedules have been disrupted, and some materials have no additional inbound vessels. We are working on reformulating some products because we will run out of supply. We are also seeing tightening in the storage industry as companies are reconsidering their inventory requirements.
- This sector showed moderate strength again this month. While the prices paid, lead times, and inventory indices showed strength, all other indices where at or just below neutral.
Trade, Transportation, and Warehousing:
- Raw materials are getting thin for steel products; bulk buying materials by data center projects is impacting availability for energy projects.
- Fuel price increases are working their way through the supply chain, and we are seeing an increase in some goods, especially imported goods.
- Sales have fallen somewhat as consumer spending is under pressure due to higher prices.
- Breakbulk and ocean container transportation costs are under significant upward pressure as of early June.
- This sector was reported as expanding at a moderate to strong pace again this month with sales/new orders, purchases, and prices paid indices registering as expanding at a rapid pace. All other indices were reported near neutral.
Professional and Business Services:
- Except for very specific technical or administrative positions, there is no shortage of people qualified to fill positions.
- Prices paid to attract people remain steady with no significant movement up or down.
- We see a significant amount of interest in AI related positions that are focused on streamlining activities and making organizations more efficient related to data manipulation to shorten the time needed to complete a project. In our view, this will ultimately result in companies keeping staffing needs to a minimum.
- This sector reported modest expansion with the employment, purchases, prices paid indices showing strength. All other indices reported at or just below neutral.
Health Care:
- The price increases that we are experiencing are related to fuel charges being passed on by many service providers such as courier and other transportation services.
- This sector reported at neutral with only the purchases and prices paid indices showing strength.
Trend of Underlying Indicators
Sales/New Order Index
The sales/new orders index fell to near neutral during the month, falling 2.3 points to 51.2 points. While non-manufacturing continued to show strength, manufacturing reported contraction in this index.
| Sales/New Orders | Higher | Same | Lower | Net | Index |
| Dec 2025 | 11% | 74% | 15% | -4% | 49.9 |
| Jan 2026 | 18% | 72% | 10% | 8% | 52.5 |
| Feb 2026 | 22% | 75% | 3% | 19% | 56.6 |
| Mar 2026 | 19% | 74% | 7% | 12% | 54.0 |
| Apr 2026 | 17% | 78% | 5% | 12% | 53.5 |
| May 2026 | 11% | 84% | 5% | 6% | 51.2 |
Production Index
The production index fell below neutral, ending at 48.9 points, down 1.6 points from last month. to 50.4 Both non-manufacturing and manufacturing reporting below neutral.
| Production | Higher | Same | Lower | Net | Index |
| Dec 2025 | 3% | 91% | 6% | -3% | 51.7 |
| Jan 2026 | 9% | 89% | 2% | 7% | 52.4 |
| Feb 2026 | 6% | 92% | 2% | 4% | 51.0 |
| Mar 2026 | 4% | 89% | 7% | -3% | 47.4 |
| Apr 2026 | 5% | 93% | 2% | 3% | 50.4 |
| May 2026 | 5% | 90% | 5% | 0% | 48.9 |
Employment Index
The employment index fell 0.2 points to 50.5, indicating continued minimal expansion for the fourth month. While non-manufacturing remained just above neutral, manufacturing was reported well below this level.
| Employment | Higher | Same | Lower | Net | Index |
| Dec 2025 | 2% | 91% | 7% | -5% | 49.3 |
| Jan 2026 | 6% | 84% | 10% | -4% | 46.7 |
| Feb 2026 | 10% | 84% | 6% | 4% | 50.9 |
| Mar 2026 | 6% | 90% | 4% | 2% | 51.0 |
| Apr 2026 | 8% | 88% | 4% | 4% | 50.7 |
| May 2026 | 8% | 86% | 6% | 2% | 50.5 |
Purchases Index
The purchases index rose 1.3 points to 55.1 points with both non-manufacturing reporting improvement to well above neutral and manufacturing retreating to just below neutral.
| Purchases | Higher | Same | Lower | Net | Index |
| Dec 2025 | 7% | 81% | 12% | -5% | 50.7 |
| Jan 2026 | 19% | 73% | 8% | 11% | 53.3 |
| Feb 2026 | 21% | 77% | 2% | 19% | 57.9 |
| Mar 2026 | 17% | 77% | 6% | 11% | 54.1 |
| Apr 2026 | 19% | 75% | 6% | 13% | 53.8 |
| May 2026 | 20% | 74% | 6% | 14% | 55.1 |
Prices Paid Index
The purchases index rose 0.8 points to 65.1 points with both non-manufacturing and manufacturing reporting strong expansion.
| Prices Paid | Higher | Same | Lower | Net | Index |
| Dec 2025 | 9% | 76% | 15% | -6% | 50.7 |
| Jan 2026 | 25% | 72% | 3% | 22% | 60.3 |
| Feb 2026 | 23% | 74% | 3% | 20% | 58.1 |
| Mar 2026 | 25% | 73% | 2% | 23% | 59.5 |
| Apr 2026 | 34% | 64% | 2% | 32% | 64.3 |
| May 2026 | 35% | 63% | 2% | 33% | 65.1 |
Lead Times Index
The purchases index rose 0.3 points to 51.3 points with manufacturing reporting strong expansion in the index and non-manufacturing reporting near neutral.
| Lead Times | Higher | Same | Lower | Net | Index |
| Dec 2025 | 4% | 94% | 2% | 2% | 53.2 |
| Jan 2026 | 8% | 88% | 4% | 4% | 54.5 |
| Feb 2026 | 7% | 89% | 4% | 3% | 50.1 |
| Mar 2026 | 17% | 79% | 4% | 13% | 54.0 |
| Apr 2026 | 7% | 91% | 2% | 5% | 51.0 |
| May 2026 | 9% | 86% | 5% | 4% | 51.3 |
Purchased Inventory Index
The purchased inventory index fell 1.1 points to 48.1. Both non-manufacturing and manufacturing reported near this level.
| Purchased Inventory | Higher | Same | Lower | Net | Index |
| Dec 2025 | 5% | 89% | 6% | -1% | 52.9 |
| Jan 2026 | 5% | 91% | 4% | 1% | 48.9 |
| Feb 2026 | 6% | 91% | 3% | 3% | 53.6 |
| Mar 2026 | 5% | 90% | 5% | 0% | 48.3 |
| Apr 2026 | 4% | 90% | 6% | -2% | 49.2 |
| May 2026 | 3% | 93% | 4% | -1% | 48.1 |
Finished Goods Inventory Index
The finished goods inventory index returned to back below neutral, falling 1.6 points to 49.7. Both manufacturing and non-manufacturing reporting near this level.
| Finished Goods Inventories | Higher | Same | Lower | Net | Index |
| Dec 2025 | 7% | 89% | 4% | 3% | 51.2 |
| Jan 2026 | 6% | 91% | 3% | 3% | 51.2 |
| Feb 2026 | 4% | 91% | 5% | -1% | 49.7 |
| Mar 2026 | 6% | 89% | 5% | 1% | 50.7 |
| Apr 2026 | 8% | 86% | 6% | 2% | 51.3 |
| May 2026 | 5% | 90% | 5% | 0% | 49.7 |
Houston PMI Calculation Methods
The Houston Purchasing Managers Index has been included as an integral part of the ISM-Houston Business Report since the Houston affiliate of the Institute for Supply Management started publishing this document in January 1995. The report and index are issued monthly as the primary deliverables from a survey of Houston area Supply Chain leaders regarding the status of key activities that provide insight into the strength of the economy. The respondents come from diverse organizations including construction, energy, engineering, health care, durable and non-durable goods manufacturing, financial and business services, wholesale and retail trade, and utilities related companies.
The Houston Purchasing Managers Index is determined from diffusion indices of the eight indicators of economic activity covered by the ISM-Houston Business Survey and Report. These underlying indicators are sales or new orders, production, employment, purchases, prices paid for major purchases, lead times from sellers, purchased materials inventory (raw materials and supplies), and finished goods inventories. The respondents to the survey report the direction of each of these activities as either up, the same, or down in comparison to the previous month. An index for each of these areas is then calculated by subtracting the percentage of respondents that sight a negative shift from the percentage that sight a positive shift. For indicators that are positively correlated with economic growth, this results in an underlying index that points to expansion when it is above zero. Indicators that are negatively correlated with growth point to expansion when they are below zero.
The final Houston PMI is calculated by applying optimal regression factors to each of the eight underlying indicators noted above. These regression factors are determined using standard regression techniques comparing these underlying indicators to the Houston-The Woodlands-Sugar Land Business Cycle Index (Houston BCI), which is reported monthly by the Federal Reserve Bank of Dallas. This top-level index is converted to a 0 to 100 scale to match that of the national Purchasing Managers Index® (PMI®) which is published monthly by the Institute for Supply Management® (ISM®). Readings over 50 for the HPMI generally indicate manufacturing expansion in Houston in the near term and readings below 50 show coming manufacturing contraction.
It is important to note that the manufacturing breakeven HPMI does not equate to the breakeven point for the overall Houston economy. ISM-Houston periodically reviews the capability of its correlations and adjusts the regression factors when appropriate. The most recent revision occurred in 2018 after it was determined that changes in the Houston economy over the previous decade had shifted the intercept of the correlation, causing a neutral Houston PMI to no longer align with a neutral Houston BCI. A Houston PMI of 45 points now equates to a neutral Houston economy as measured by the Houston BCI. A similar offset between the National PMI and the National economy has existed for some time.
Use of ISM-Houston Business Report Content
All information included in this report is protected under copyright law, and ISM-Houston reserves all rights to this content. ISM-Houston grants a limited, revocable license for personal, non-commercial use, including access, printing, and display of content. Requests for permission to reproduce or redistribute the ISM-Houston Business Report content should be directed to the ISM-Houston Business Survey Committee at hpmi@ism-houston.org.
ISM-Houston assumes no liability, obligation, or responsibility for the accuracy, completeness, or timeliness of the information contained herein. This includes any errors, omissions, or delays in providing the report. Furthermore, ISM-Houston shall not be liable for any damages, whether direct, incidental, consequential, or special, arising from the use or reliance on the information provided in this report.
ISM-Houston Business Report Background
The ISM-Houston Purchasing Manager Report has provided some of the best information regarding what is happening in the Greater Houston area economy for over 30 years. It delivers significant analytical data along with a summary of what Houston area Supply Chain Leaders are saying about the economy and is subscribed to by a wide range of global business leaders, economists, researchers, and reporters.
The report and index are published monthly as the primary deliverables from a survey of Houston area Supply Chain professionals. These highly engaged leaders provide information on key activities that are related to the strength of the economy. They come from diverse organizations including construction, energy, engineering, health care, durable and non-durable goods manufacturing, financial and business services, wholesale and retail trade, and utilities related companies.
We are always looking to improve our coverage of the industries that make up our economy. Please join us to help make our results even more representative of what’s happening in Houston by completing this signup form.