
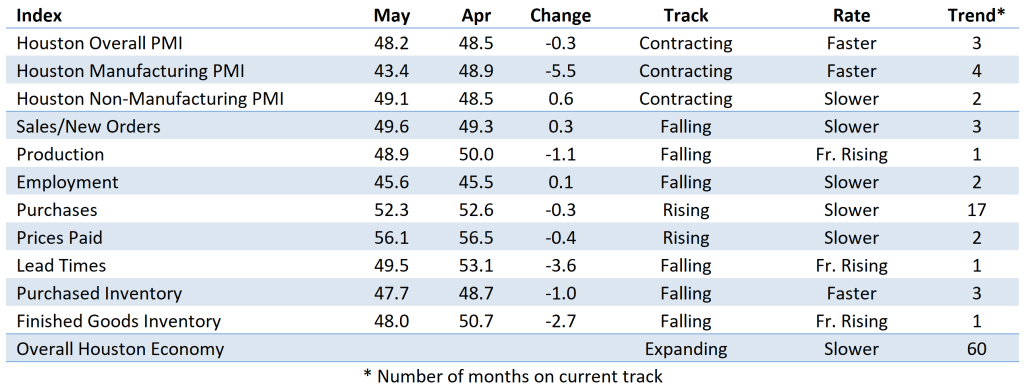
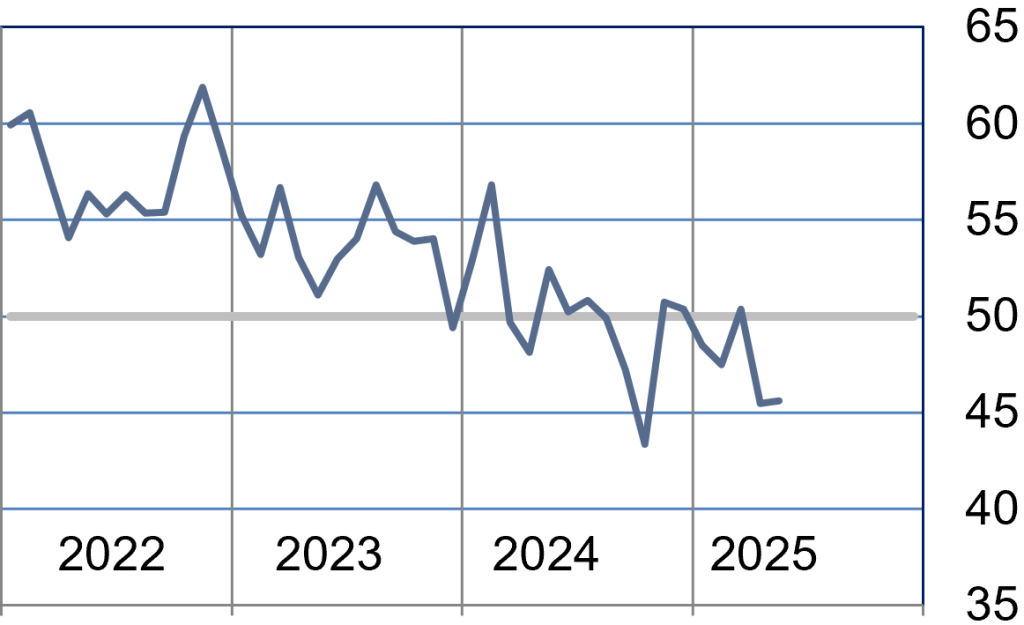
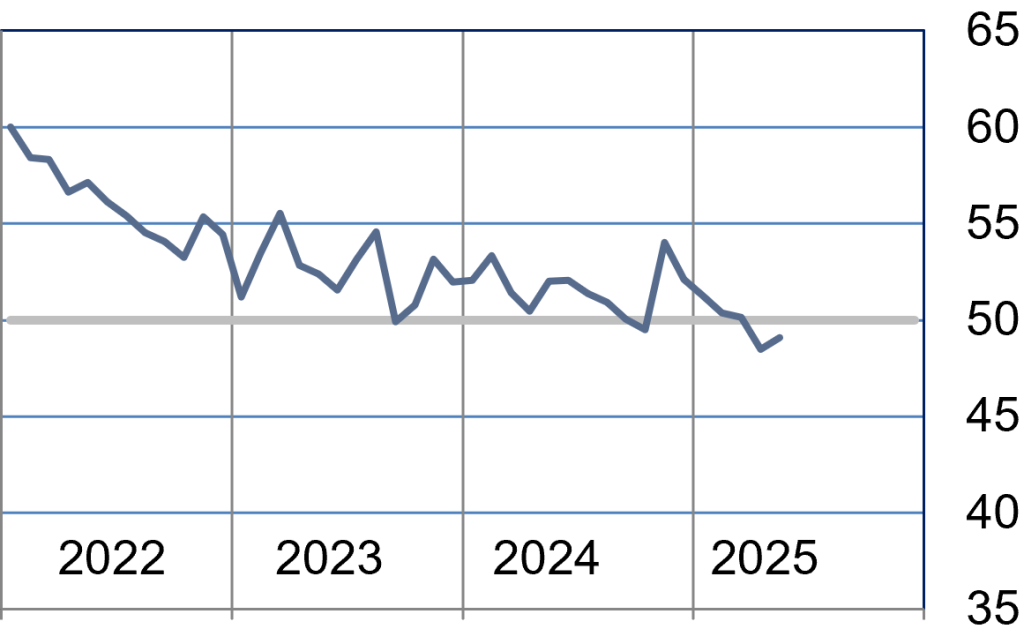
(Houston, Texas) – According to Houston area supply chain executives, economic activity in Houston contracted for the month of May, with manufacturing indicting moderate contraction and non-manufacturing indicating slight contraction, contracting at a slower rate than April. The overall economy expanded for the 60th month.
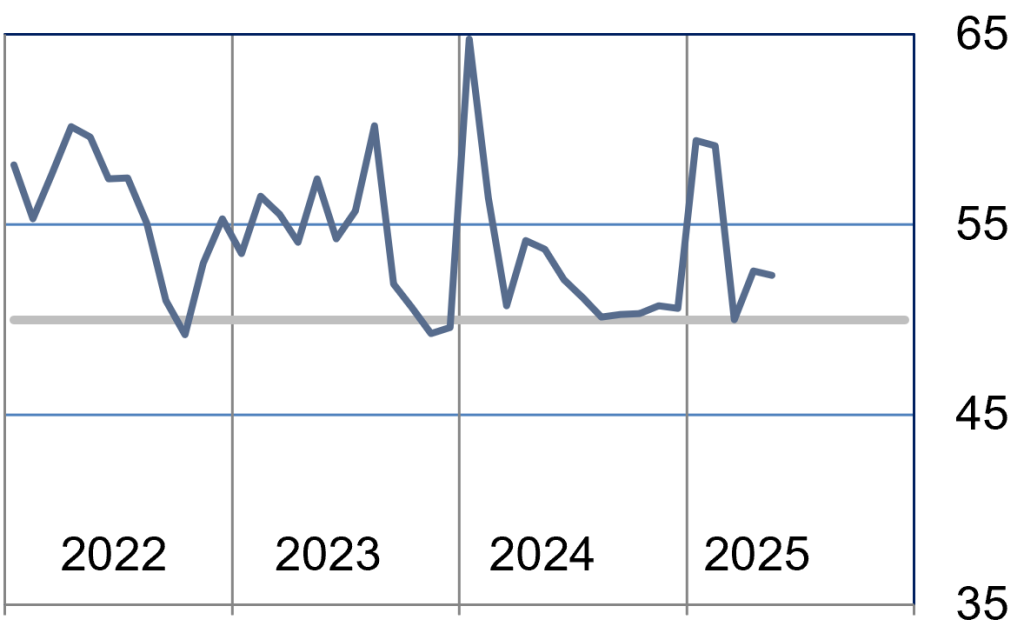
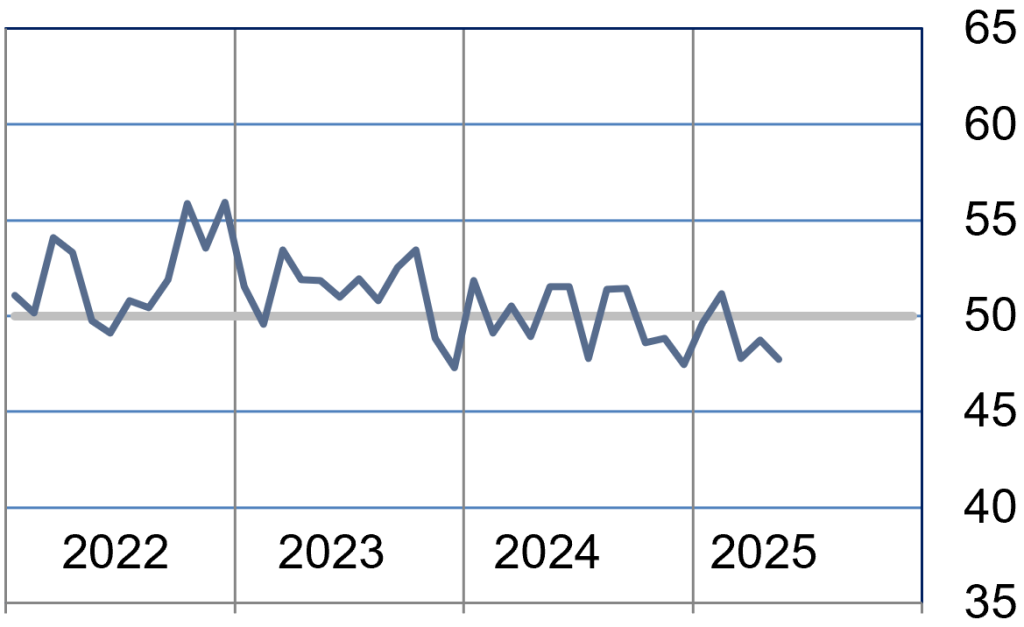
The Houston Purchasing Managers Index contracted to 48.2 points. The lead times index, one of the three indicators with a strong positive correlation with the economy, shifted from expansion to contraction in the month of May, falling 3.6 points to 49.5 points. The other indexes with strong positive correlation, sales/new orders and employment, continued contracted in May. The employment index rose 0.1 points, contracting slower at 45.6 points. The sales/new order index rose 0.3 points to 49.6 points, also contracting at a slower pace than April. The finished goods inventory index, the underlying indicator that has the strongest inverse correlation with economic activity, decreased 2.7 points to 48.0 points; switching from expansion to contraction.
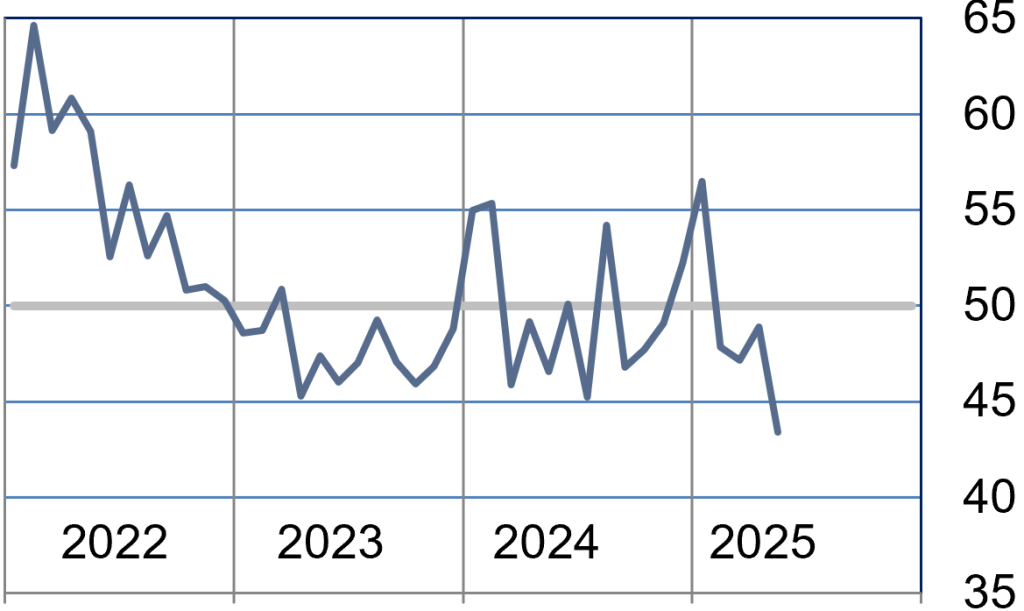
The Houston manufacturing PMI fell 5.5 points during the month to 43.4 points; contracting at a faster rate than April. The nonmanufacturing PMI increased 0.6 points to 49.1 points.
On an industry specific basis, health care, trade, transportation and warehousing reported strong expansion. Nondurable goods manufacturing, oil and gas extraction and real estate indicated significant contraction.
Click here for the hard copy version of the report.
Indices at a Glance
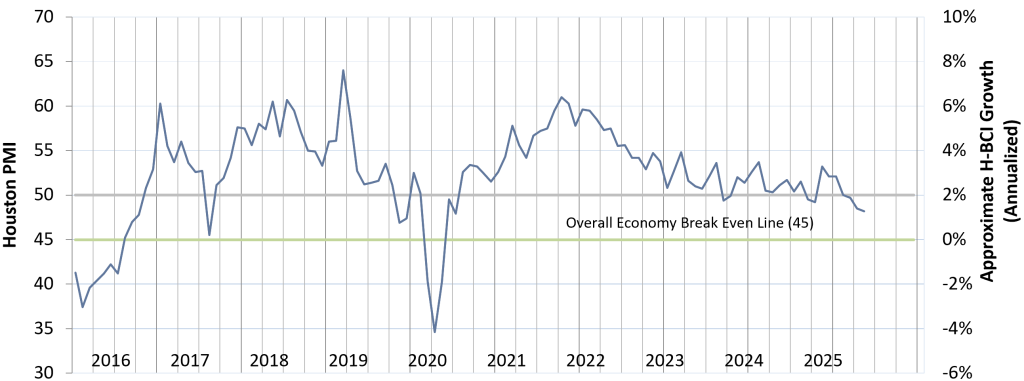
Houston PMI Trend
Houston PMI readings over 50 generally indicate that respondents see their activities as expanding. An HPMI above 45 normally correlates with expansion of the Houston-The Woodlands-Sugar Land Business Cycle Index (H-BCI).
Commodities Reported to have Notable Price Changes or to be in Short Supply
Up in Price: I&E labor; isobutane, propylene; platinum, palladium, aluminum, copperŦ, steel, lined pipe, carbon steel flanges, fittings and valves, cement; transformers, switchgear, circuit breakers, electrical equipment, measurement instruments, transmitters, gauges, flow meters; imported goods for resale; ocean container freight from Asia
Down in Price: Crude oil, natural gas; propane, natural gas liquids, ethane; copperŦ, nickel, steel; electronics, electrical components; some luxury goods
In Short Supply: Skilled labor, specialized construction labor, professional services; phthalic anhydride; transformers, switchgear, circuit breakers, electrical equipment, electrical components, automation equipment; gas turbines, rotating equipment, helicopter parts
‡ reported as up or down by different respondents
What our Respondents are Saying
Oil and Gas Exploration, and Key Support Services:
- Tarriff impacts are still somewhat unknown and are driving us to review our strategies frequently
- For 2025, we see a limited pricing impact due to tariffs, low single digit inflation
- Making significant efforts to monitor ongoing tariffs news and develop mitigation options
- US and Texas rig counts continue to fall
- This sector continued to contract in May, at an even higher rate than April; all 8 indexes indicated contraction for the month with only production and purchased inventory contracting at a slower pace than April.
Construction:
- The unclear tariff situation makes it hard to predict price developments.
- Motor fuel prices were flat in May
- Global demand for steel remains weak, with favorable pricing and lead times for buyers
- This sector switched from slight contraction to slight expansion in May. While most indexes remained flat versus April, employment saw a big boost, expanding strongly.
Durable Goods Manufacturing:
- The tariff situation is increasing costs and lead times
- Durable goods saw slight expansion in April with strong sales and production. There was slight contraction in the employment, purchase and lead time indexes
Non-durable Goods Manufacturing:
- Olefins cracker feedstock prices remain low
- Refinery rates continue to rise as we approach the summer driving season
- This sector saw a steeper contraction in May vs. April, prices and lead time expanded, with all other indexes contracting.
Wholesale and Retail Trade:
- Customers producing more and increasing defense spending due to pending tariffs
- Sales are performing well
- Imported goods more expensive due to uncertainty around tariffs
- This sector’s performance indicated expansion for the month of May, with strong expansion in sales, purchases and prices paid. All other indexes indicated slight contraction for the month.
Transportation and Warehousing:
- U.S. and Houston air passenger traffic rose in May consistent with normal seasonal changes
- Breakbulk and container shipping costs are rising as we move into June
- This sector reported expansion at the same rate as April, employment was the only index that contracted but it was a slower rate than April. The prices paid index saw a sharp increase month over month.
Real Estate:
- Industrial real estate continues to perform well with vacancy rates below 10%
- Office real estate showed more weakness with vacancies continuing to run above 25%
- This sector saw slightly slower contraction in May vs. April. The employment, purchase, price and lead time index contracted at a slower rate while sales and production were faster. The purchased inventory index flipped from expansion to slight contraction.
Professional and Business Services:
- There are no shortages of qualified people available to fill open positions
- Recent layoffs by Apache, Dow, and announced reductions in staff by companies like Shell, BP, and Chevron only serve to validate that the market has plenty of qualified professionals in all disciplines
- Prices of hourly contractors and direct hires are stable
- Even though the availability of qualified people exceeds the opportunities available, we are not seeing any significant reducing in what companies are willing to pay when they are hiring.
- Client companies are looking at ways to reduce costs in anticipation of materials costs increasing due to Tariffs, and other factors such as lead times, and deliverability
- The key word continues to be “uncertainty” in the marketplace which has led most to wait and see what happens with Tariffs and then plan accordingly
- This sector’s performance indicated expansion for the month of May, with strong expansion in sales and purchases. The employment index flipped from contraction to expansion while lead time, production and purchased inventory saw slight contraction.
Trend of Underlying Indicators
The Houston PMI is based on diffusion indices for eight underlying indicators. The net value of each indicator is simply the percentage of respondents who cite a positive shift from the previous month minus the percentage who cite a negative shift. The diffusion index is calculated based on the percent of respondents reporting higher results plus one-half of those responding the same with seasonal adjustments to the Sales/New Orders, Production, Employment, and Prices Paid indices based on an X13 ARIMA forecast. Values above 50 for Sales/New Orders, Production, Employment, Prices Paid, and Lead Times generally point towards expansion and values below 50 signal contraction. Note that the Prices Paid Index may not follow this trend late in an economic expansion. The Inventory measures have an inverse correlation at most forecast horizons, meaning that values below 50 point to expansion and values above point to contraction. The Purchases index is inversely correlated with economic activity at the three-month forecast horizon.
Sales/New Orders (Seasonally Adjusted)
The sales index indicated slower contraction in May. The manufacturing sector saw more rapid contraction while nonmanufacturing flipped from contraction to slight expansion.
| Higher | Same | Lower | Net | Index | |
| Dec/24 | 18% | 76% | 6% | 12% | 58.2 |
| Jan/25 | 22% | 74% | 4% | 18% | 57.3 |
| Feb/25 | 16% | 81% | 3% | 13% | 53.6 |
| Mar/25 | 14% | 74% | 12% | 2% | 49.4 |
| Apr/25 | 16% | 71% | 13% | 3% | 49.3 |
| May/25 | 15% | 75% | 10% | 5% | 49.6 |
Production Index (Seasonally Adjusted)
The production index reverted back to contraction for May. There was a sharp decline in manufacturing going from strong expansion to moderate contraction. Nonmanufacturing contracted at a slower rate.
| Higher | Same | Lower | Net | Index | |
| Dec/24 | 10% | 85% | 5% | 5% | 52.9 |
| Jan/25 | 13% | 82% | 5% | 8% | 53.2 |
| Feb/25 | 6% | 91% | 3% | 3% | 50.6 |
| Mar/25 | 8% | 85% | 7% | 1% | 49.2 |
| Apr/25 | 8% | 85% | 7% | 1% | 50.0 |
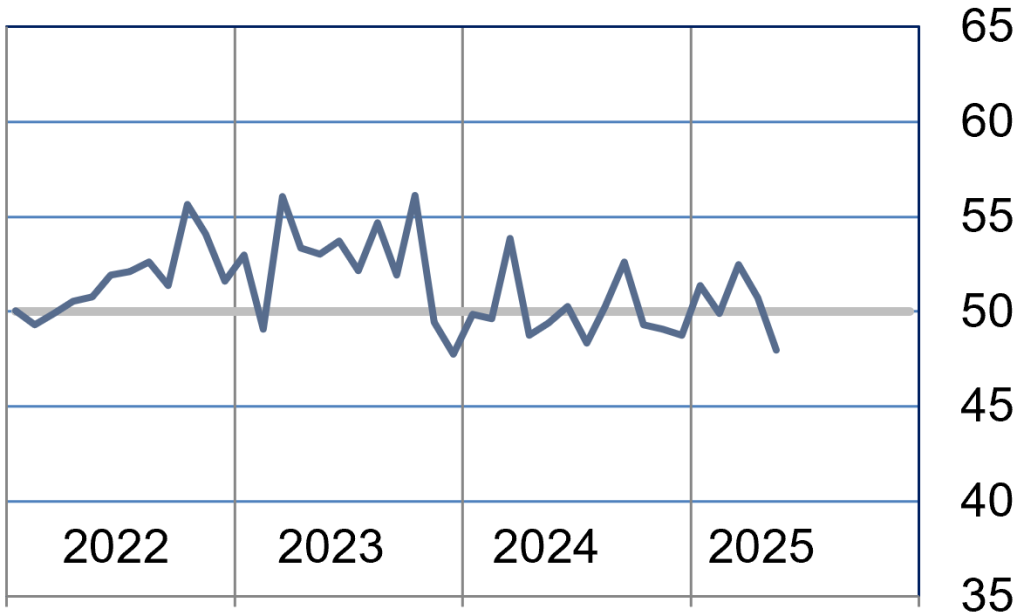
| May/25 | 6% | 88% | 6% | 0% | 48.9 |
Employment Index (Seasonally Adjusted)
The employment index continued contracting in May. The manufacturing sector contracted at a faster rate with nonmanufacturing contracting at a slower rate.
| Higher | Same | Lower | Net | Index | |
| Dec/24 | 6% | 91% | 3% | 3% | 50.3 |
| Jan/25 | 3% | 94% | 3% | 0% | 48.5 |
| Feb/25 | 2% | 93% | 5% | -3% | 47.5 |
| Mar/25 | 9% | 83% | 8% | 1% | 50.4 |
| Apr/25 | 5% | 84% | 11% | -6% | 45.5 |
| May/25 | 9% | 75% | 16% | -7% | 45.6 |
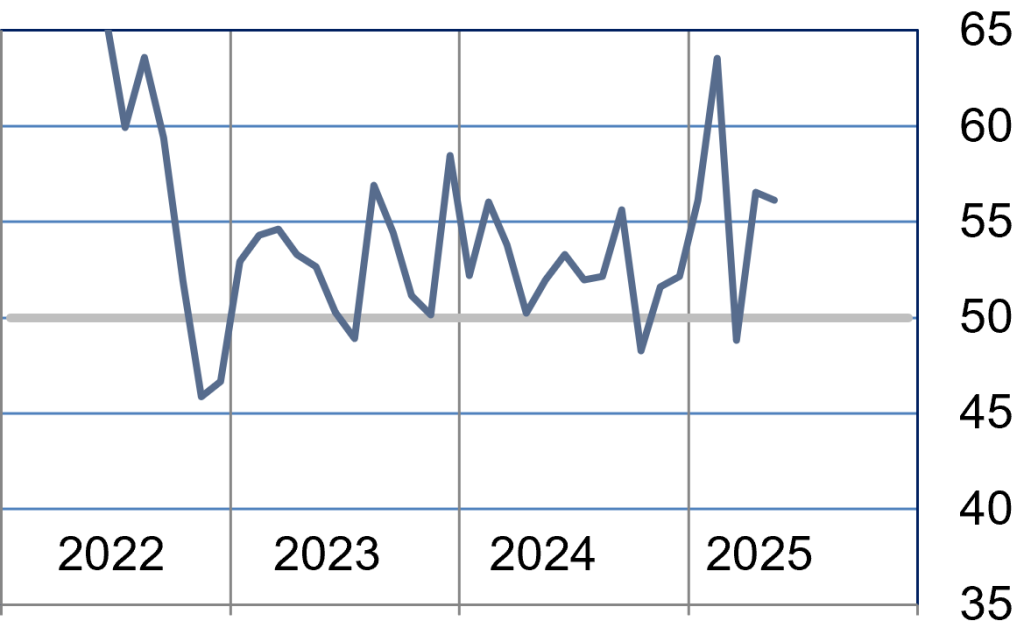
Purchases Index (Not Seasonally Adjusted)
The purchase index continues to expand, driven by more rapid expansion in nonmanufacturing. The manufacturing index flipped from expansion to contraction.
| Higher | Same | Lower | Net | Index | |
| Dec/24 | 7% | 87% | 6% | 1% | 50.6 |
| Jan/25 | 25% | 73% | 2% | 23% | 59.4 |
| Feb/25 | 23% | 75% | 2% | 21% | 59.2 |
| Mar/25 | 11% | 80% | 9% | 2% | 50.0 |
| Apr/25 | 19% | 73% | 8% | 11% | 52.6 |
| May/25 | 16% | 76% | 8% | 8% | 52.3 |
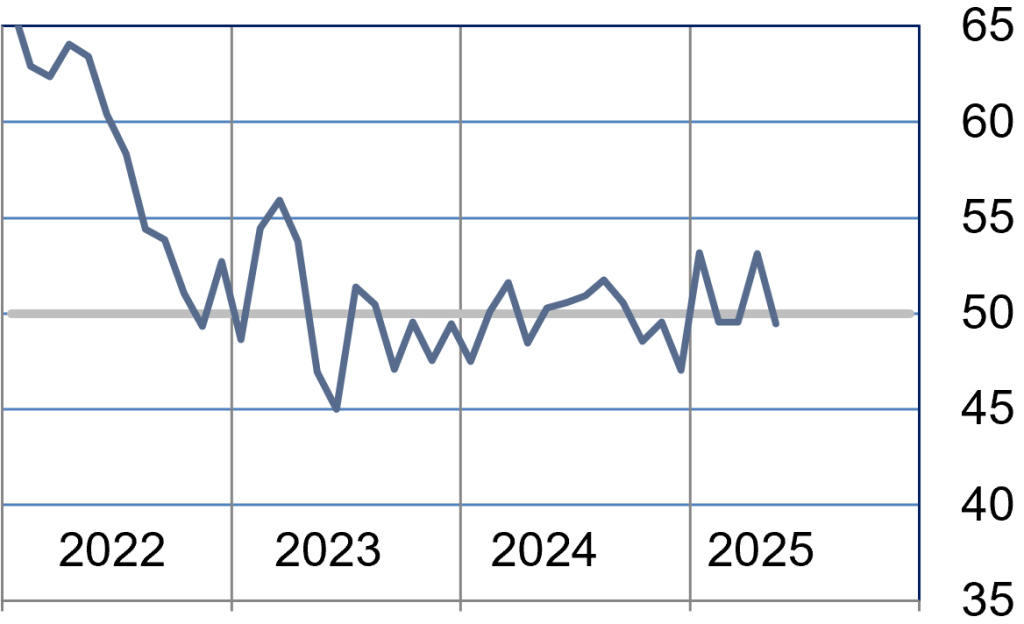
Prices Paid Index (Seasonally Adjusted)
The prices paid index continues to expand, but at a slower rate than April. It was driven by more rapid expansion in nonmanufacturing. The manufacturing index expanded at a slower rate.
| Higher | Same | Lower | Net | Index | |
| Dec/24 | 13% | 82% | 5% | 8% | 52.2 |
| Jan/25 | 15% | 83% | 2% | 13% | 56.1 |
| Feb/25 | 33% | 65% | 2% | 31% | 63.5 |
| Mar/25 | 13% | 76% | 11% | 2% | 48.8 |
| Apr/25 | 18% | 79% | 3% | 15% | 56.5 |
| May/25 | 17% | 80% | 3% | 14% | 56.1 |
Lead Times Index (Not Seasonally Adjusted)
The lead time index indicated slight contraction in May. The manufacturing index expanded but slower than April. The nonmanufacturing index shifted from expansion to contraction.
| Higher | Same | Lower | Net | Index | |
| Dec/24 | 2% | 90% | 8% | -6% | 47.0 |
| Jan/25 | 5% | 91% | 4% | 1% | 53.2 |
| Feb/25 | 3% | 95% | 2% | 1% | 49.5 |
| Mar/25 | 8% | 89% | 3% | 5% | 49.6 |
| Apr/25 | 11% | 87% | 2% | 9% | 53.1 |
| May/25 | 4% | 93% | 3% | 1% | 49.5 |
Purchased Inventory Index (Not Seasonally Adjusted)
The purchased inventory index contracted at a faster rate in May. Manufacturing and nonmanufacturing both saw faster contraction than April.
| Higher | Same | Lower | Net | Index | |
| Dec/24 | 2% | 91% | 7% | -5% | 47.5 |
| Jan/25 | 5% | 93% | 2% | 3% | 49.6 |
| Feb/25 | 6% | 87% | 7% | -1% | 51.2 |
| Mar/25 | 6% | 87% | 7% | -1% | 47.8 |
| Apr/25 | 2% | 93% | 5% | -3% | 48.7 |
| May/25 | 2% | 94% | 4% | -2% | 47.7 |
Finished Goods Inventory Index (Not Seasonally Adjusted)
The finished goods inventory contracted, following a downward trend from April. The manufacturing sector saw a steep decline while nonmanufacturing contracted slightly.
| Higher | Same | Lower | Net | Index | |
| Dec/24 | 2% | 94% | 4% | -2% | 48.7 |
| Jan/25 | 5% | 93% | 2% | 3% | 51.4 |
| Feb/25 | 6% | 88% | 6% | 0% | 49.9 |
| Mar/25 | 7% | 91% | 2% | 5% | 52.5 |
| Apr/25 | 5% | 91% | 4% | 1% | 50.7 |
| May/25 | 2% | 92% | 6% | -4% | 48.0 |
Projections for Key Long-Term Indicators
In addition to the current status of business activities, respondents to the ISM-Houston Business Survey also provide feedback on their view of the direction of the sales/new orders and employment indices six months into the future.
Six-Month Projection of the Sales/New Orders Index
The future sales index showed a sharp decline for the manufacturing sector vs March. The nonmanufacturing sector saw a moderate slowing; however, still indicates expansion.
| Higher | Same | Lower | Net | Index | |
| Dec/24 | 7% | 87% | 6% | 1% | 52.2 |
| Jan/25 | 25% | 73% | 2% | 23% | 56.5 |
| Feb/25 | 23% | 75% | 2% | 21% | 47.8 |
| Mar/25 | 11% | 80% | 9% | 2% | 47.2 |
| Apr/25 | 19% | 73% | 8% | 11% | 48.9 |
| May/25 | 16% | 76% | 8% | 8% | 43.4 |
Six Month Projection of Employment Index
The future employment index indicated contraction but a slower pace than April. The contraction is driven manufacturing, with nonmanufacturing indicating slight expansion.
| Higher | Same | Lower | Net | Index | |
| Dec/24 | 14% | 81% | 5% | 9% | 52.1 |
| Jan/25 | 13% | 82% | 5% | 8% | 51.3 |
| Feb/25 | 17% | 73% | 10% | 7% | 50.4 |
| Mar/25 | 19% | 71% | 10% | 9% | 50.2 |
| Apr/25 | 13% | 72% | 15% | -2% | 48.5 |
| May/25 | 12% | 75% | 13% | -1% | 49.1 |
Background on the ISM-Houston Business Report and HPMI Calculation Methods
The Houston Purchasing Managers Index has been included as an integral part of the ISM-Houston Business Report since the Houston chapter of the Institute for Supply Management started publication of this document in January 1995. The report and index are published monthly as the primary deliverables from a survey of Houston area Supply Chain leaders regarding the status of key activities believed to provide insight into the strength of the economy. The respondents come from diverse organizations including construction, energy, engineering, health care, durable and non-durable goods manufacturing, financial and business services, wholesale and retail trade, and utilities related companies.
The Houston Purchasing Managers Index is determined from diffusion indices of the eight indicators of economic activity covered by the ISM-Houston Business Survey and Report. These underlying indicators are sales or new orders, production, employment, purchases, prices paid for major purchases, lead times from sellers, purchased materials inventory (raw materials and supplies), and finished goods inventories. The respondents to the survey report the direction of each these activities as either up, the same or down in comparison to the previous month. An index for each of these areas is then calculated by subtracting the percentage of respondents that sight a negative shift from the percentage that sight a positive shift. For indicators that are positively correlated with economic growth, this results in an underlying index that points to expansion when it is above zero. Indicators that are negatively correlated with growth point to expansion when they are below zero.
The final Houston PMI is calculated by applying optimal regression factors to each of the eight underlying indicators noted above. These regression factors are determined using standard regression techniques comparing these underlying indicators to the Houston-The Woodlands-Sugar Land Business Cycle Index (Houston BCI), which is reported on a monthly basis by the Federal Reserve Bank of Dallas. This top-level index is converted to a 0 to 100 scale to match that of the national Purchasing Managers Index® (PMI®) which is published monthly by the Institute for Supply Management® (ISM®). Readings over 50 for the HPMI generally indicate manufacturing expansion in the Houston in the near term and readings below 50 show coming manufacturing contraction.
It is important to note that the manufacturing breakeven HPMI does not equate to the breakeven point for the overall Houston economy. ISM-Houston periodically reviews the capability of its correlations and adjusts the regression factors when appropriate. The most recent revision occurred as a result of a review undertaken during the third quarter of 2018, which determined that changes in the Houston economy over the last decade have shifted the intercept of the correlation, causing a neutral Houston PMI to no longer align with a neutral Houston BCI. A Houston PMI of 45 points now equates to a neutral Houston economy as measured by the Houston BCI. A similar offset between the National PMI and the National economy has existed for some time.
Use of ISM-Houston Business Report Content
All information contained in this report is protected by copyright laws and ISM-Houston retains all rights to this Content. ISM-Houston hereby grants you a limited, revocable license to access, print, and display this Content solely for your personal, non-commercial use. Requests for permission to reproduce or redistribute ISM-Houston Business Report Content can be made by contacting the ISM-Houston Business Survey Committee at hpmi@ism-houston.org.
ISM-Houston shall not have any liability, duty, or obligation for or relating to the ISM-Houston Business Report Content or other information contained herein, any errors, inaccuracies, omissions or delays in providing any ISM-Houston Business Report Content, or for any actions taken in reliance thereon. In no event shall ISM-Houston be liable for any special, incidental, or consequential damages, arising out of the use of the ISM-Houston Business Report.