
For release June 12, 2023
May ISM-Houston Business Report
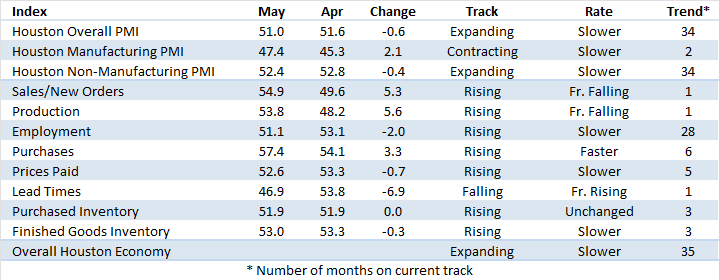
Houston PMI at 51.0 (down 0.6 points)
Sales/New Orders Expanding
Production Expanding
Employment Expanding
Prices Paid Expanding
Lead Times Contracting
Finished Goods Inventories Expanding
(Houston, Texas) – According to Houston area supply chain executives, economic activity in Houston expanded at slower pace in May. Manufacturing sector activity continues to report a significant rate of contraction while nonmanufacturing activity showed continued expansion at a modestly slower rate.
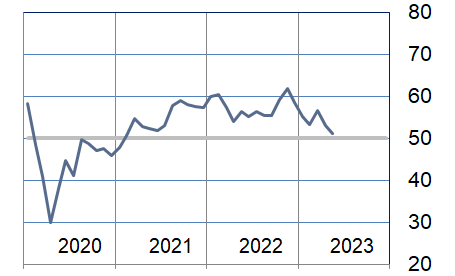
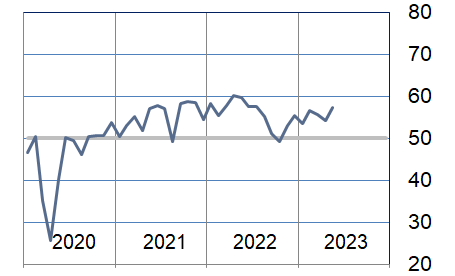
The Houston Purchasing Managers Index fell 0.6 points to 51.0. Two of the three underlying indicators that have the strongest positive correlation with the Houston economy (sales/new orders and employment) are pointing to modest to strong economic expansion. The third (lead times) is now pointing to contraction. The sales/new orders index rose 5.3 points to 54.9. The employment index fell 2.0 points to 51.1. The lead times index fell 6.9 points to 46.9. The finished goods inventory index, the underlying indicator that has the strongest inverse correlation with economic activity, fell 0.3 points to 53.0, giving a signal of potential economic contraction.
The Houston Manufacturing PMI rose 2.1 points to 47.4, continuing to provide a strong indication of potential overall economic contraction. The nonmanufacturing PMI fell 0.4 points to 52.4, showing a lower expansion rate for the industries in this sector.
On an industry specific basis, professional and management services, and health care reported strong expansion. Trade, transportation & warehousing, oil & gas, and construction reported modest expansion. Manufacturing, leisure and hospitality, and real estate continue to report low to moderate contraction.
The Houston PMI provides a measure of current economic activity in the greater Houston area and a forecast of likely shifts in activity over a three-month forecast horizon. These indicators have a possible range of 0 to 100. Readings over 50 generally indicate goods producing industry expansion; readings below 50 show contraction. A PMI above 45 generally correlates with expansion of the Houston-The Woodlands-Sugar Land Business Cycle Index. The current and forecast PMI indices are based on diffusion indices for eight underlying indicators: Sales/New Orders, Production, Employment, Purchases, Prices Paid, Lead Times, Purchase Inventory, and Finished Goods Inventory.
The Houston PMI provides a measure of current economic activity in the greater Houston area and a forecast of likely shifts in activity over a three-month forecast horizon. These indicators have a possible range of 0 to 100. Readings over 50 generally indicate goods producing industry expansion; readings below 50 show contraction. A PMI above 45 generally correlates with expansion of the Houston-The Woodlands-Sugar Land Business Cycle Index. The current and forecast PMI indices are based on diffusion indices for eight underlying indicators: Sales/New Orders, Production, Employment, Purchases, Prices Paid, Lead Times, Purchase Inventory, and Finished Goods Inventory.
Click here to see the PDF version of the full report.
Indices at a Glance
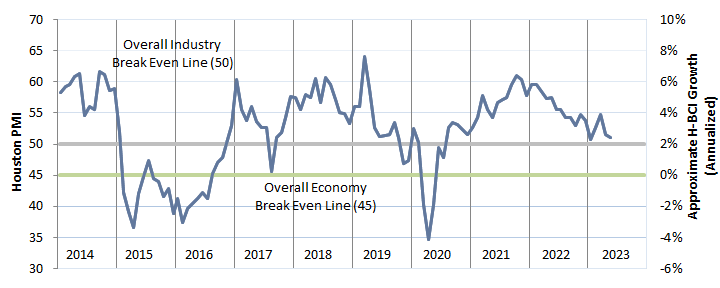
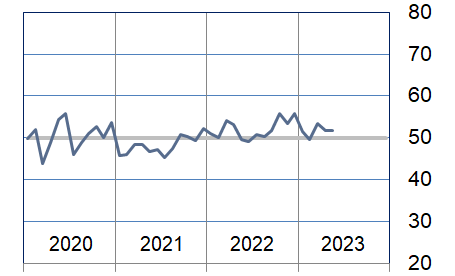
Houston PMI Trend
Houston PMI readings over 50 generally indicate that respondents see their activities as expanding. An HPMI above 45 normally correlates with expansion of the Houston-The Woodlands-Sugar Land Business Cycle Index (H-BCI).
Commodities Reported to have Notable Price Changes or to be in Short Supply
Up in Price: General and craft labor; elastomers, specialty chemicals, diglycolamine (DGA); low temperature piping materials, MRO materials, road construction products, copper, motors, transformers, electrical gear and components, software and hardware; vehicles.
Down in Price: Proppants; crude oil, diesel, jet fuel, natural gas; ethane, propane, butane, isobutane, natural gas liquids, natural gasoline, naphtha; ethylene, propylene, butadiene, ethylene oxide and derivatives, plastic resins, polypropylene, PVC; carbon steel, copper, nickel, rhodium, molybdenum, titanium; carbon steel; freight.
In Short Supply: Senior consultants, electrical engineers, skilled and general craft labor; prime medical/surgical supplies; diglycolamine (DGA), fluoropolymers (PFAs), ammonia; low temp piping materials, construction supplies, some mechanical equipment; computer hardware, electrical equipment, power supplies, electrical components, electrical gear, generators, transfer switches; vehicles; shipyards; offshore vessels.
‡ reported as up or down by different respondents
What our Respondents are Saying
Oil and Gas Exploration, and Key Support Services:
- Beginning to see more stability in price, with some categories possibly trending down in price going into the second half.
- This sector saw continued growth at a significantly slower pace; while the production and purchases indices showed continued strength, the employment, prices paid, and lead times indices all fell to neutral.
Construction:
- Our challenge is to find enough qualified personnel.
- Performance in this sector fell to just above neutral; the sales/new orders index stayed near neutral; the employment, purchases, and prices paid indices continued to show strength; the lead times index fell to well below neutral.
Durable Goods Manufacturing:
- This sector’s performance stayed marginally below neutral; while the sales/new orders index rose significantly to match a strong production index, the employment and lead times indices fell below neutral.
Non-durable Goods Manufacturing:
- Materials prices seem to have stabilized while we continue to see services price increases.
- Lead times are improving, and supply chain disruptions have taken a backseat compared to the last 12 months.
- Supplier backlogs continue to stay high for engineered products.
- Products to make hydrogen are getting snug.
- This sector’s performance remained well below neutral; while the production and prices paid indices improved to well above neutral, the sales/new orders and employment indices stayed below this level; all other indices were reported as neutral.
Trade, Transportation, and Warehousing:
- Watching the economy closely as well as hurricane season.
- This sector’s performance improved modestly during the month but remained near neutral; the sales/new orders and purchases indices showed strength while the employment, prices paid, and lead times indices showed weakness.
Real-Estate Services:
- New home construction and sales continue to fall.
- This sector’s remained modestly below neutral with housing, industrial, and retail real estate all reporting at this level.
Leisure and Hospitality:
- This sector’s performance remained near neutral with all indices reporting at this level.
Professional and Business Services:
- Our clients are concerned that inflation in the service economy has not yet fallen to the Federal Reserve Board’s targets and that they will continue to raise the federal funds rate; too much tightening may lead to a recession.
- Hourly and salary rates are up from this time last year but remain unchanged from January.
- This sector continues to report strong expansion with strength in the sales/new orders, employment, purchases, and lead times indices.
Health Care:
- The effect of the final notice from the government on adjusting Medicare advantage rates downward is being felt throughout our industry; this is somewhat offset for us due to our rapid growth; elsewhere, we understand that hiring is being put on hold and cost reductions are becoming front and center.
- Healthcare organizations are back to the pre-pandemic level of operations.
- To control costs, we are relying less on name brand products and more on substitute products that are of the same form, function and clinical requirements; this approach has created more savings opportunities for Supply Chain and the organization as a whole.
- This sector remained well above neutral; the sales/new orders and purchases indices rejoined the employment, and prices paid indices showing considerable strength while the lead times index fell well below neutral.
Government:
- We are still struggling to maintain staff due to the private sector paying high salaries.
- This sector’s performance fell below neutral with the employment index showing contraction while the purchases index returned to near neutral.
Trend of Underlying Indicators
The Houston PMI is based on diffusion indices for eight underlying indicators. The net value of each indicator is simply the percentage of respondents who cite a positive shift from the previous month minus the percentage who cite a negative shift. The diffusion index is calculated based on the percent of respondents reporting higher results plus one-half of those responding the same with seasonal adjustments to the Sales/New Orders, Production, Employment, and Prices Paid indices based on an X13 ARIMA forecast. Values above 50 for Sales/New Orders, Production, Employment, Prices Paid, and Lead Times generally point towards expansion and values below 50 signal contraction. Note that the Prices Paid Index may not follow this trend late in an economic expansion. The Inventory measures have an inverse correlation at most forecast horizons, meaning that values below 50 point to expansion and values above point to contraction. The Purchases index is inversely correlated with economic activity at the three-month forecast horizon.
Sales/New Orders
The sales/new orders index rose back above neutral with significant improvements in both the nonmanufacturing and manufacturing sectors. Manufacturing rose back above neutral.
| Higher | Same | Lower | Net | Index | |
| Dec/22 | 8% | 78% | 14% | -6% | 49.5 |
| Jan/23 | 7% | 85% | 8% | -1% | 47.2 |
| Feb/23 | 10% | 85% | 5% | 5% | 51.4 |
| Mar/23 | 17% | 76% | 7% | 10% | 54.7 |
| Apr/23 | 12% | 81% | 7% | 5% | 49.6 |
| May/23 | 19% | 75% | 6% | 13% | 54.9 |
Production Index
The production index also rose back above neutral with both manufacturing and nonmanufacturing showing significant improvement.
| Higher | Same | Lower | Net | Index | |
| Dec/22 | 5% | 84% | 11% | -6% | 48.8 |
| Jan/23 | 9% | 84% | 7% | 2% | 51.3 |
| Feb/23 | 9% | 86% | 5% | 4% | 51.8 |
| Mar/23 | 13% | 80% | 7% | 6% | 53.2 |
| Apr/23 | 9% | 85% | 6% | 3% | 48.2 |
| May/23 | 11% | 86% | 3% | 8% | 53.8 |
Employment Index
The employment index fell to just above neutral with manufacturing rising to near neutral and nonmanufacturing falling to just above this level.
| Higher | Same | Lower | Net | Index | |
| Dec/22 | 16% | 81% | 3% | 13% | 58.6 |
| Jan/23 | 14% | 86% | 0% | 14% | 55.3 |
| Feb/23 | 13% | 81% | 6% | 7% | 53.2 |
| Mar/23 | 23% | 69% | 8% | 15% | 56.7 |
| Apr/23 | 18% | 78% | 4% | 14% | 53.1 |
| May/23 | 12% | 80% | 8% | 4% | 51.1 |
Purchases Index
The purchases index rose to indicate relatively strong expansion. Manufacturing rose significantly to end at neutral. Nonmanufacturing purchases expanded at a moderately faster rate.
| Higher | Same | Lower | Net | Index | |
| Dec/22 | 13% | 77% | 10% | 3% | 55.3 |
| Jan/23 | 10% | 87% | 3% | 7% | 53.4 |
| Feb/23 | 15% | 83% | 2% | 13% | 56.5 |
| Mar/23 | 16% | 79% | 5% | 11% | 55.5 |
| Apr/23 | 17% | 74% | 9% | 8% | 54.1 |
| May/23 | 19% | 77% | 4% | 15% | 57.4 |
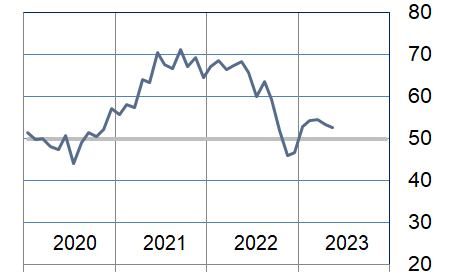
Prices Paid Index
The prices paid index showed expansion at a somewhat lower rate. Nonmanufacturing reported at neutral while manufacturing reported this index as expanding at a rapid pace.
| Higher | Same | Lower | Net | Index | |
| Dec/22 | 7% | 76% | 17% | -10% | 46.7 |
| Jan/23 | 7% | 91% | 2% | 5% | 52.9 |
| Feb/23 | 16% | 81% | 3% | 13% | 54.3 |
| Mar/23 | 24% | 69% | 7% | 17% | 54.6 |
| Apr/23 | 11% | 85% | 4% | 7% | 53.3 |
| May/23 | 13% | 78% | 9% | 4% | 52.6 |
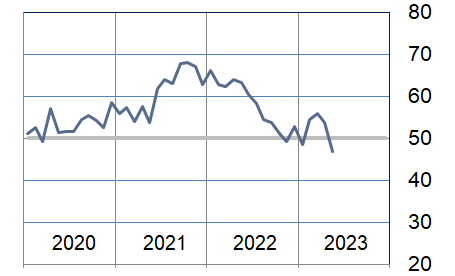
Lead Times Index
The lead times index fell significantly to end well below neutral. Both manufacturing and nonmanufacturing reported this index as contracting.
| Higher | Same | Lower | Net | Index | |
| Dec/22 | 11% | 81% | 8% | 3% | 52.7 |
| Jan/23 | 4% | 89% | 7% | -3% | 48.7 |
| Feb/23 | 13% | 82% | 5% | 8% | 54.4 |
| Mar/23 | 20% | 71% | 9% | 11% | 55.9 |
| Apr/23 | 12% | 83% | 5% | 7% | 53.8 |
| May/23 | 8% | 78% | 14% | -6% | 46.9 |
Purchased Inventory Index
This inventory index was also relatively unchanged buoyed by strong expansion in the manufacturing sectors. Durable goods inventories are expanding at a much faster rate than nondurable goods.
| Higher | Same | Lower | Net | Index | |
| Dec/22 | 7% | 90% | 3% | 4% | 55.9 |
| Jan/23 | 4% | 95% | 1% | 3% | 51.5 |
| Feb/23 | 6% | 88% | 6% | 0% | 49.6 |
| Mar/23 | 10% | 86% | 4% | 6% | 53.4 |
| Apr/23 | 12% | 79% | 9% | 3% | 51.9 |
| May/23 | 8% | 88% | 4% | 4% | 51.9 |
Finished Goods Inventory Index
The finished goods inventory index was reported as expanding at a slower pace with both the nonmanufacturing and manufacturing sectors continuing to report expansion of this index.
| Higher | Same | Lower | Net | Index | |
| Dec/22 | 10% | 85% | 5% | 5% | 51.6 |
| Jan/23 | 6% | 94% | 0% | 6% | 53.0 |
| Feb/23 | 5% | 89% | 6% | -1% | 49.1 |
| Mar/23 | 16% | 80% | 4% | 12% | 56.1 |
| Apr/23 | 11% | 85% | 4% | 7% | 53.3 |
| May/23 | 9% | 88% | 3% | 6% | 53.0 |
Background on the ISM-Houston Business Report and HPMI Calculation Methods
The Houston Purchasing Managers Index has been included as an integral part of the ISM-Houston Business Report since the Houston chapter of the Institute for Supply Management started publication of this document in January 1995. The report and index are published monthly as the primary deliverables from a survey of Houston area Supply Chain leaders regarding the status of key activities believed to provide insight into the strength of the economy. The respondents come from diverse organizations including construction, energy, engineering, health care, durable and non-durable goods manufacturing, financial and business services, wholesale and retail trade, and utilities related companies.
The Houston Purchasing Managers Index is determined from diffusion indices of the eight indicators of economic activity covered by the ISM-Houston Business Survey and Report. These underlying indicators are sales or new orders, production, employment, purchases, prices paid for major purchases, lead times from sellers, purchased materials inventory (raw materials and supplies), and finished goods inventories. The respondents to the survey report the direction of each these activities as either up, the same or down in comparison to the previous month. An index for each of these areas is then calculated by subtracting the percentage of respondents that sight a negative shift from the percentage that sight a positive shift. For indicators that are positively correlated with economic growth, this results in an underlying index that points to expansion when it is above zero. Indicators that are negatively correlated with growth point to expansion when they are below zero.
The final Houston PMI is calculated by applying optimal regression factors to each of the eight underlying indicators noted above. These regression factors are determined using standard regression techniques comparing these underlying indicators to the Houston-The Woodlands-Sugar Land Business Cycle Index (Houston BCI), which is reported on a monthly basis by the Federal Reserve Bank of Dallas. This top-level index is converted to a 0 to 100 scale to match that of the national Purchasing Managers Index® (PMI®) which is published monthly by the Institute for Supply Management® (ISM®). Readings over 50 for the HPMI generally indicate manufacturing expansion in the Houston in the near term and readings below 50 show coming manufacturing contraction.
It is important to note that the manufacturing breakeven HPMI does not equate to the breakeven point for the overall Houston economy. ISM-Houston periodically reviews the capability of its correlations and adjusts the regression factors when appropriate. The most recent revision occurred as a result of a review undertaken during the third quarter of 2018, which determined that changes in the Houston economy over the last decade have shifted the intercept of the correlation, causing a neutral Houston PMI to no longer align with a neutral Houston BCI. A Houston PMI of 45 points now equates to a neutral Houston economy as measured by the Houston BCI. A similar offset between the National PMI and the National economy has existed for some time.
Use of ISM-Houston Business Report Content
All information contained in this report is protected by copyright laws and ISM-Houston retains all rights to this Content. ISM-Houston hereby grants you a limited, revocable license to access, print, and display this Content solely for your personal, non-commercial use. Requests for permission to reproduce or redistribute ISM-Houston Business Report Content can be made by contacting the ISM-Houston Business Survey Committee at hpmi@ism-houston.org.
ISM-Houston shall not have any liability, duty, or obligation for or relating to the ISM-Houston Business Report Content or other information contained herein, any errors, inaccuracies, omissions or delays in providing any ISM-Houston Business Report Content, or for any actions taken in reliance thereon. In no event shall ISM-Houston be liable for any special, incidental, or consequential damages, arising out of the use of the ISM-Houston Business Report.