Analysis and report by Ross Harvison/ISM-Houston Business Survey Committee
Houston PMI at 52.3 (down 0.1 points)
Sales/New Orders Expanding
Production Contracting
Employment Expanding
Prices Paid Expanding
Lead Times Expanding
Finished Goods Inventories Expanding
(Houston, Texas) – According to Houston area supply chain executives the Houston economy expanded again in March. The manufacturing sector expanded for the third month, and non-manufacturing expanded for the second month. The overall Houston economy expanded for the 70th month in a row.
The Houston Purchasing Managers Index fell 0.1 points to 52.3 in March, indicating continued modest growth in the overall economy. All three of the underlying indicators that have a strong direct correlation with economic activity (sales/new orders, employment, and lead times) are pointing to strength. The sales/new orders index fell 2.6 points to 54.0 points, the employment index rose a minimal 0.1 points to 51.0, and the lead times index rose 3.9 points to 54.0 points. The finished goods inventory index, the underlying indicator that has the strongest inverse correlation with economic activity, rose 1.0 points to 50.7, pointing to economic contraction for the first time in 9 months.
The Houston Manufacturing PMI fell a modest 0.7 points during the month to 50.9 points, indicating minimal expansion in this sector for the third month. Durable goods manufacturing reported significant weakness, while non-durable goods reported strength. The non-manufacturing PMI was flat at 52.6, pointing to modest expansion for the second month.
On an industry specific basis construction, trade/transportation/warehousing, professional services, and nondurable goods manufacturing reporting strong expansion. Oil and gas extraction, and durable goods manufacturing reported weakness.
Please click here to go to the hardcopy version of the report.
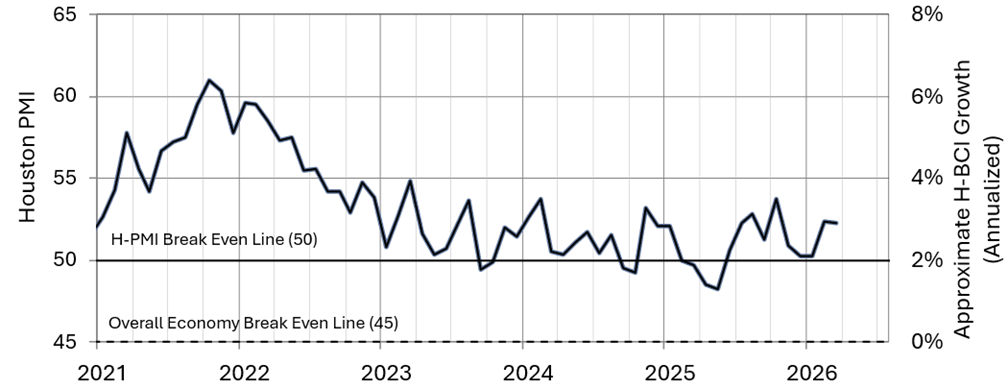
Houston PMI Trend
Indices at a Glance
Houston PMI readings over fifty indicate that respondents see their activities as expanding. An H-PMI above 45 normally correlates with expansion of the Houston-The Woodlands-Sugar Land Business Cycle Index.
| Index | Mar | Feb | Change | Track | Rate | Trend* |
| Houston Overall PMI | 52.3 | 52.4 | -0.1 | Expanding | Slower | 10 |
| Houston Manufacturing PMI | 50.9 | 51.6 | -0.7 | Expanding | Slower | 3 |
| Houston Non-Manufacturing PMI | 52.6 | 52.6 | 0.0 | Expanding | Unchanged | 2 |
| Sales/New Orders | 54.0 | 56.6 | -2.6 | Rising | Slower | 3 |
| Production | 47.4 | 51.0 | -3.6 | Falling | Fr. Rising | 1 |
| Employment | 51.0 | 50.9 | 0.1 | Rising | Faster | 2 |
| Purchases | 54.1 | 57.9 | -3.8 | Rising | Slower | 27 |
| Prices Paid | 59.5 | 58.1 | 1.4 | Rising | Faster | 6 |
| Lead Times | 54.0 | 50.1 | 3.9 | Rising | Faster | 4 |
| Purchased Inventory | 48.3 | 53.6 | -5.3 | Falling | Fr. Rising | 1 |
| Finished Goods Inventory | 50.7 | 49.7 | 1.0 | Rising | Fr. Falling | 1 |
| Houston Economy | Expanding | Slower | 70 | |||
| * Number of months on current track | ||||||
Commodities Reported to be Up/Down in Price or in Short Supply
Up in Price: General labor; crude oil, gasoline, diesel, jet fuel, base oil products, oil field chemicals; propane, natural gas liquids, normal butane, isobutane, natural gasoline, naphtha; ethylene, propylene, PVC resins, PE resins, PP resins, ethylene oxide and propylene oxide derivatives; electrical equipment, electrical components, cabling; stainless steel, tungsten, copper, lead, cement; trucking, compartment vessels, ocean container freight from Asia.
Down in Price: Natural Gas.
In Short Supply: Skilled labor; base crude products, oil field chemicals, raw materials from Asia; electrical equipment, electrical components, medium voltage cable, generators; some stainless steel knitting wire; mobile trailers, trucking, compartmented vessels.
What Our Respondents Are Saying:
Oil and Gas Exploration, and Key Support Services:
- The last month has been challenging with the situation in the Strait and damage to assets in the area.
- We expect disruptions in our freight forwarding, chemicals, and lubricants categories.
- Diesel and jet fuel prices will escalate further.
- There are oil field chemical shortages and price increases due to Gulf war impacts.
- This sector moved back to indicating contraction after one month pointing to expansion. While the prices paid and lead times indices were reported as expanding at a rapid pace, all other indicators were reported as contracting.
Construction:
- Advanced manufacturing and data centers are driving our growth.
- The conflict in Iran is expected to result in higher prices for goods and services globally.
- This sector continues to experience strong expansion. The sales/new orders, employment, purchases, prices paid, and lead times indices continue to point to significant strength.
Durable Goods Manufacturing:
- This sector weakened to contracting during this month. While the prices paid and lead times indices showed strength, the sales/new orders, production, employment indices were all reported well below neutral. The inventory indices showed significant expansion.
Non-durable Goods Manufacturing:
- Our markets are flat.
- We are projecting long-term raw material supply disruptions for base oils with additional impact on where they are being produced. With the damage seen to date, some companies are seeing slight upticks in sales (because others have lost capacity) but the net loss of available volume will likely push prices higher.
- Cracker feedstock prices rose significantly in March.
- This sector returned to moderate strength during the month with the sales, purchases, prices paid, and lead times indices all reported as expanding at a strong pace. The finished goods inventory index also pointed to economic expansion. The production and employment indices were reported near neutral.
Trade, Transportation, and Warehousing:
- The effects of the Middle East conflict are starting to be seen.
- Young people are transactional while older employees were relationship builders. In times of shortages, including force majeure, appropriate risk management requires relationship builders.
- The war in the middle east is creating dislocations in the market.
- This sector returned to moderate to strong expansion during the month with sales/new orders, purchases, prices paid, and lead times indices reported as expanding at a rapid pace. The employment index joined all other indices being reported near neutral.
Professional and Business Services:
- As in the past several months, we have seen no shortages of qualified people to fill jobs, except for highly unusual technical positions.
- Pricing has been very stable in the hiring market.
- It is generally accepted that the oil prices will return to normal pricing levels around $70/bbl once the Iran Conflict is resolved.
- This sector continues to report expansion with the sales/new orders, employment, and purchases, indices showing strength. All other indices reported near neutral.
Trend of Underlying Indicators
Sales/New Order Index (Seasonally Adjusted)
The sales/new orders index softened modestly during the month, falling 2.6 points to 54.0 points. Non-manufacturing industries continued to show strength. Manufacturing activities fell below neutral, driven by weakness in durable goods manufacturing.
| Sales/New Orders | Higher | Same | Lower | Net | Index |
| Oct 2025 | 16% | 79% | 5% | 11% | 60.8 |
| Nov 2025 | 11% | 83% | 6% | 5% | 54.4 |
| Dec 2025 | 11% | 74% | 15% | -4% | 49.9 |
| Jan 2026 | 18% | 72% | 10% | 8% | 52.5 |
| Feb 2026 | 22% | 75% | 3% | 19% | 56.6 |
| Mar 2026 | 19% | 74% | 7% | 12% | 54.0 |
Production Index (Seasonally Adjusted)
The production index fell 3.6 points to 47.4 with both non-manufacturing and durable goods manufacturing reporting weakness. Nondurable goods reported strength in this index.
| Production | Higher | Same | Lower | Net | Index |
| Oct 2025 | 11% | 85% | 4% | 7% | 55.3 |
| Nov 2025 | 9% | 86% | 5% | 4% | 52.6 |
| Dec 2025 | 3% | 91% | 6% | -3% | 51.7 |
| Jan 2026 | 9% | 89% | 2% | 7% | 52.4 |
| Feb 2026 | 6% | 92% | 2% | 4% | 51.0 |
| Mar 2026 | 4% | 89% | 7% | -3% | 47.4 |
Employment Index (Seasonally Adjusted)
The employment index rose 0.1 points to 51.0, indicating minimal expansion for the second month. Manufacturing returned to reporting this index as contracting after one month of expansion. Non-manufacturing strengthened modestly.
| Employment | Higher | Same | Lower | Net | Index |
| Oct 2025 | 8% | 83% | 9% | -1% | 50.3 |
| Nov 2025 | 9% | 83% | 8% | 1% | 51.2 |
| Dec 2025 | 2% | 91% | 7% | -5% | 49.3 |
| Jan 2026 | 6% | 84% | 10% | -4% | 46.7 |
| Feb 2026 | 10% | 84% | 6% | 4% | 50.9 |
| Mar 2026 | 6% | 90% | 4% | 2% | 51.0 |
Purchases Index (Seasonally Adjusted)
The purchases index fell 3.8 points to 54.1 points with both non-manufacturing and manufacturing reporting expansion.
| Purchases | Higher | Same | Lower | Net | Index |
| Oct 2025 | 15% | 78% | 7% | 8% | 55.8 |
| Nov 2025 | 14% | 71% | 15% | -1% | 51.5 |
| Dec 2025 | 7% | 81% | 12% | -5% | 50.7 |
| Jan 2026 | 19% | 73% | 8% | 11% | 53.3 |
| Feb 2026 | 21% | 77% | 2% | 19% | 57.9 |
| Mar 2026 | 17% | 77% | 6% | 11% | 54.1 |
Prices Paid Index (Seasonally Adjusted)
The prices paid index rose 1.4 points to 59.5 points, indicating stronger expansion of this index. Both nonmanufacturing and manufacturing reported this index as expanding at a rapid pace.
| Prices Paid | Higher | Same | Lower | Net | Index |
| Oct 2025 | 12% | 78% | 10% | 2% | 51.1 |
| Nov 2025 | 13% | 75% | 12% | 1% | 54.1 |
| Dec 2025 | 9% | 76% | 15% | -6% | 50.7 |
| Jan 2026 | 25% | 72% | 3% | 22% | 60.3 |
| Feb 2026 | 23% | 74% | 3% | 20% | 58.1 |
| Mar 2026 | 25% | 73% | 2% | 23% | 59.5 |
Lead Time Index (Seasonally Adjusted)
The lead times index rose 3.9 points to 54.0 with manufacturing reporting a significant increase in this index. Nonmanufacturing reported modestly above neutral.
| Lead Times | Higher | Same | Lower | Net | Index |
| Oct 2025 | 8% | 87% | 5% | 3% | 52.6 |
| Nov 2025 | 2% | 89% | 9% | -7% | 47.8 |
| Dec 2025 | 4% | 94% | 2% | 2% | 53.2 |
| Jan 2026 | 8% | 88% | 4% | 4% | 54.5 |
| Feb 2026 | 7% | 89% | 4% | 3% | 50.1 |
| Mar 2026 | 17% | 79% | 4% | 13% | 54.0 |
Purchased Inventory Index (Seasonally Adjusted)
The purchased inventory index dropped back below neutral, falling 5.3 points to 48.3. The non-manufacturing purchased inventory index came in near neutral. Manufacturing reported purchased inventories as expanding at a significant rate for a second month.
| Purchased Inventory | Higher | Same | Lower | Net | Index |
| Oct 2025 | 6% | 87% | 7% | -1% | 50.6 |
| Nov 2025 | 8% | 89% | 3% | 5% | 52.5 |
| Dec 2025 | 5% | 89% | 6% | -1% | 52.9 |
| Jan 2026 | 5% | 91% | 4% | 1% | 48.9 |
| Feb 2026 | 6% | 91% | 3% | 3% | 53.6 |
| Mar 2026 | 5% | 90% | 5% | 0% | 48.3 |
Finished Goods Inventory Index (Seasonally Adjusted)
The finished goods inventory index moved to near neutral, falling 1.5 points to 49.7. Both manufacturing and non-manufacturing reported at this level.
| Finished Goods Inventories | Higher | Same | Lower | Net | Index |
| Oct 2025 | 10% | 84% | 6% | 4% | 51.9 |
| Nov 2025 | 13% | 84% | 3% | 10% | 54.5 |
| Dec 2025 | 7% | 89% | 4% | 3% | 51.2 |
| Jan 2026 | 6% | 91% | 3% | 3% | 51.2 |
| Feb 2026 | 4% | 91% | 5% | -1% | 49.7 |
| Mar 2026 | 6% | 89% | 5% | 1% | 50.7 |
Houston PMI Calculation Methods
The Houston Purchasing Managers Index has been included as an integral part of the ISM-Houston Business Report since the Houston affiliate of the Institute for Supply Management started publishing this document in January 1995. The report and index are issued monthly as the primary deliverables from a survey of Houston area Supply Chain leaders regarding the status of key activities that provide insight into the strength of the economy. The respondents come from diverse organizations including construction, energy, engineering, health care, durable and non-durable goods manufacturing, financial and business services, wholesale and retail trade, and utilities related companies.
The Houston Purchasing Managers Index is determined from diffusion indices of the eight indicators of economic activity covered by the ISM-Houston Business Survey and Report. These underlying indicators are sales or new orders, production, employment, purchases, prices paid for major purchases, lead times from sellers, purchased materials inventory (raw materials and supplies), and finished goods inventories. The respondents to the survey report the direction of each of these activities as either up, the same, or down in comparison to the previous month. An index for each of these areas is then calculated by subtracting the percentage of respondents that sight a negative shift from the percentage that sight a positive shift. For indicators that are positively correlated with economic growth, this results in an underlying index that points to expansion when it is above zero. Indicators that are negatively correlated with growth point to expansion when they are below zero.
The final Houston PMI is calculated by applying optimal regression factors to each of the eight underlying indicators noted above. These regression factors are determined using standard regression techniques comparing these underlying indicators to the Houston-The Woodlands-Sugar Land Business Cycle Index (Houston BCI), which is reported monthly by the Federal Reserve Bank of Dallas. This top-level index is converted to a 0 to 100 scale to match that of the national Purchasing Managers Index® (PMI®) which is published monthly by the Institute for Supply Management® (ISM®). Readings over 50 for the HPMI generally indicate manufacturing expansion in Houston in the near term and readings below 50 show coming manufacturing contraction.
It is important to note that the manufacturing breakeven HPMI does not equate to the breakeven point for the overall Houston economy. ISM-Houston periodically reviews the capability of its correlations and adjusts the regression factors when appropriate. The most recent revision occurred in 2018 after it was determined that changes in the Houston economy over the previous decade had shifted the intercept of the correlation, causing a neutral Houston PMI to no longer align with a neutral Houston BCI. A Houston PMI of 45 points now equates to a neutral Houston economy as measured by the Houston BCI. A similar offset between the National PMI and the National economy has existed for some time.
Use of ISM-Houston Business Report Content
All information included in this report is protected under copyright law, and ISM-Houston reserves all rights to this content. ISM-Houston grants a limited, revocable license for personal, non-commercial use, including access, printing, and display of content. Requests for permission to reproduce or redistribute the ISM-Houston Business Report content should be directed to the ISM-Houston Business Survey Committee at hpmi@ism-houston.org.
ISM-Houston assumes no liability, obligation, or responsibility for the accuracy, completeness, or timeliness of the information contained herein. This includes any errors, omissions, or delays in providing the report. Furthermore, ISM-Houston shall not be liable for any damages, whether direct, incidental, consequential, or special, arising from the use or reliance on the information provided in this report.
ISM-Houston Business Report Background
The ISM-Houston Purchasing Manager Report has provided some of the best information regarding what is happening in the Greater Houston area economy for over 30 years. It delivers significant analytical data along with a summary of what Houston area Supply Chain Leaders are saying about the economy and is subscribed to by a wide range of global business leaders, economists, researchers, and reporters.
The report and index are published monthly as the primary deliverables from a survey of Houston area Supply Chain professionals. These highly engaged leaders provide information on key activities that are related to the strength of the economy. They come from diverse organizations including construction, energy, engineering, health care, durable and non-durable goods manufacturing, financial and business services, wholesale and retail trade, and utilities related companies.
We are always looking to improve our coverage of the industries that make up our economy. Please join us to help make our results even more representative of what’s happening in Houston by completing this signup form.