
(Houston, Texas) – According to Houston area supply chain executives, economic activity in Houston contracted at a very minimal rate in March, with manufacturing contracting at a faster rate and non-manufacturing showing minimal expansion. The overall economy expanded for the 58th month.
The Houston Purchasing Managers Index fell 0.3 points to 49.7 points. The sales/new orders and lead times indices, two of the three indicators with a strong positive correlation with the economy, both pointed toward contraction in March. The sales/new orders index dropped 4.2 points to 49.4 points. The lead times index rose 0.1 points to 49.6 points. The third indicator with a strong positive correlation, employment, moved from indicating contraction to very modest expansion, rising 2.9 points to 50.4 points. The finished goods inventory index, the underlying indicator that has the strongest inverse correlation with economic activity, increased 2.6 points to 52.5 points.
The Houston Manufacturing PMI fell 0.6 points during the month to 47.2 points, indicating a higher level of contraction. The non-manufacturing PMI decreased 0.2 points to 50.2 points, pointing to very minimal expansion. There is too much economic turmoil at present to provide a three-month forecast for the overall, manufacturing, and nonmanufacturing PMIs. However, all data are indicating downward pressure.
On an industry specific basis, professional and business services, and health care report strong growth. Construction, nondurable goods manufacturing, and trade/transportation/warehousing reported near neutral. Oil and gas, and durable goods showed strong contraction.
Click here for the hard copy version of the report.
Indices at a Glance
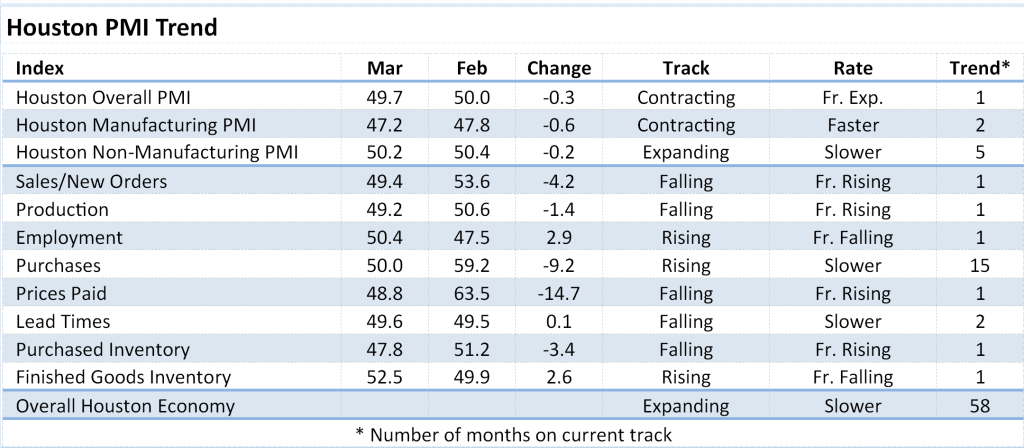
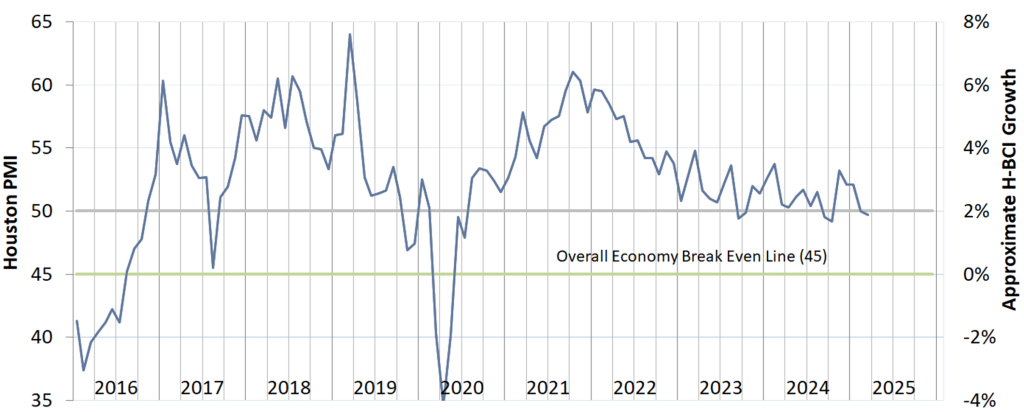
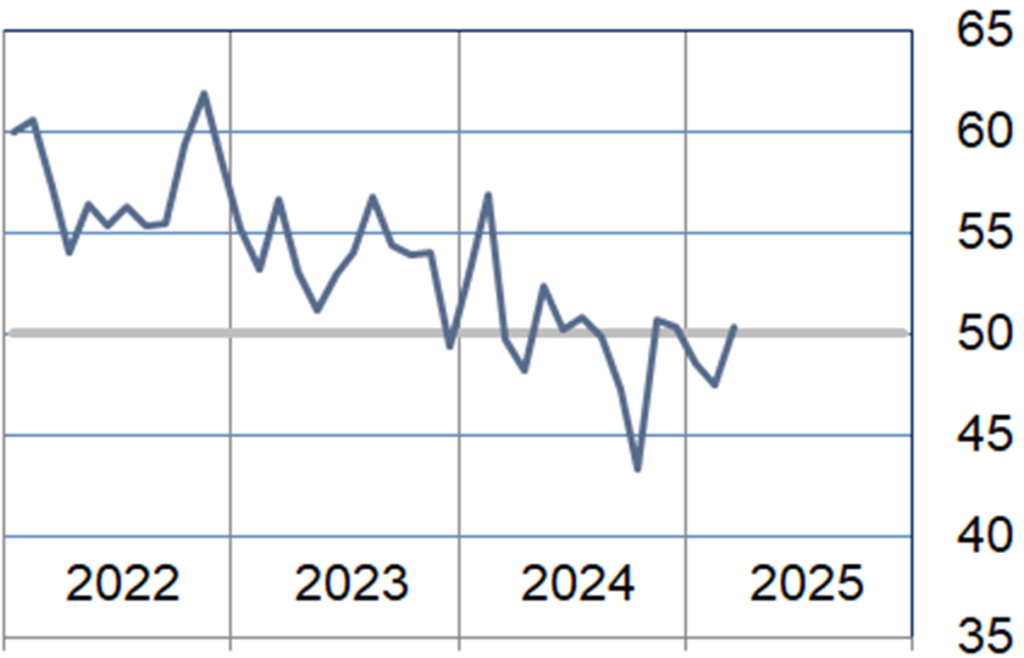
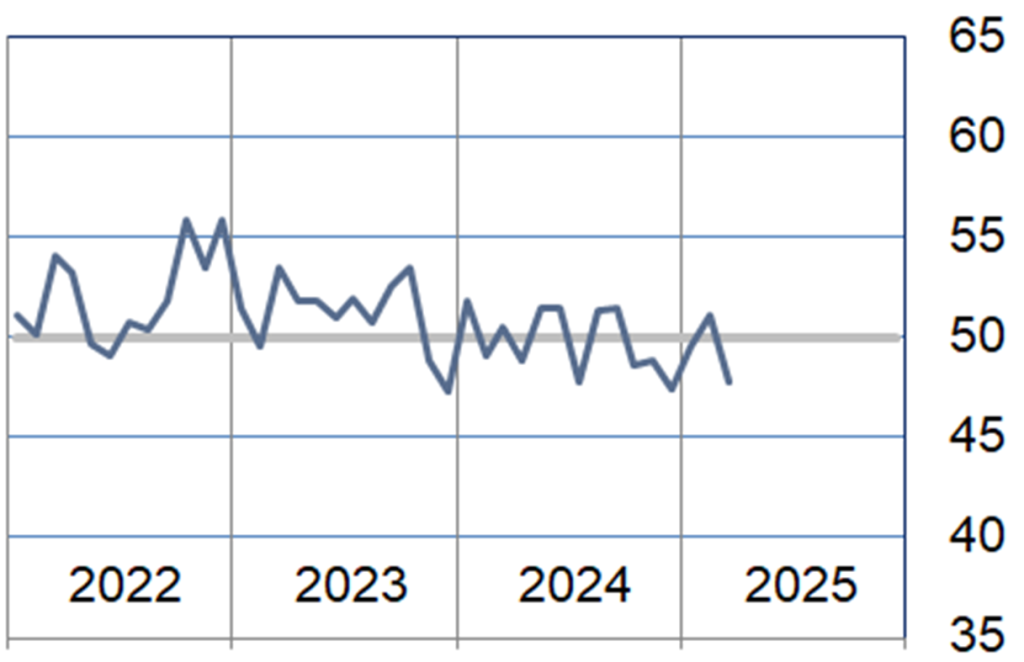
Houston PMI Trend
Houston PMI readings over 50 generally indicate that respondents see their activities as expanding. An HPMI above 45 normally correlates with expansion of the Houston-The Woodlands-Sugar Land Business Cycle Index (H-BCI).
Commodities Reported to have Notable Price Changes or to be in Short Supply
Up in Price: General labor, skilled labor; chemicals and gases, caustic, ethane; rhodium, cobalt; carbon steel
Down in Price: Diesel, jet fuel; olefins cracker feedstocks, propane, normal butane, isobutane, glycols, ethylene
In Short Supply: General labor, skilled labor; wire rod, clay; automation equipment, instrumentation, electrical gear, electrical equipment, electrical components, transformers, switchgear; emergency diesel generators
‡ reported as up or down by different respondents
What our Respondents are Saying
Oil and Gas Exploration, and Key Support Services:
- We Continue to monitor the tariff landscape and model impacts
- Lots of uncertainty due to the new tariffs applied in the US
- We continue to monitor the impact of US Tariffs on costs; expect higher prices for OCTG (casing and tubing)
- This sector continued to contract in March with the sales, production, purchases, prices paid, and lead times indices all showing significant contraction. The employment index was reported near neutral.
Construction:
- Impacts from US tariffs have not been substantially felt yet
- Cost increases and schedule disruptions are expected in the next quarter due to tariffs
- This sector’s performance fell significantly to end near neutral during the month with all indices report near neutral except for prices paid, which continued to be reported well above neutral
Durable Goods Manufacturing:
- Incoming sales orders have slowed month over month, with the lack of new oil drilling activity and volatile tariff situation being the primary contributors
- Durable goods returned to indicating significant contraction in March with the sales/new orders, production, employment, and purchases indices reporting well below neutral; prices paid, lead times and inventories were well above neutral
Non-durable Goods Manufacturing:
- Olefins cracker feedstock prices came under downward pressure in late March, and this accelerated in early April
- Ethylene and propylene prices fell considerably in March and are continuing the trend in early April
- This sector’s performance rose to near neutral with the sales/new orders, production, purchases, prices paid, and lead times indices expanding at a very healthy pace; the employment index came in well below neutral and inventories rose.
Wholesale and Retail Trade:
- Uncertainty over tariffs is expected to have a negative effect on sales
- This sector’s performance stayed near neutral for the month with strong sales/ new orders and purchases indices being offset by a significantly contracting prices paid index.
Transportation and Warehousing:
- We are already seeing impacts from tariffs and inflationary pressure
- US air passenger traffic rose significantly in March, consistent with normal seasonal changes
- This sector’s performance came in near neutral with strong purchases, prices paid, and lead times indices being offset by a very weak sales/new orders index
Professional and Business Services:
- Demand for general and professional labor is picking up a bit
- More companies are requesting either contractors or direct hire staff
- Companies are attempting to keep the prices paid in line
- We do not see either hourly contractor or direct hire pay going down
- We are seeing more companies indicating they want to either add to staff or replace staff with hourly contractors
- This sector’s performance improved to strong expansion led by very strong sales/new orders and employment indices.
Trend of Underlying Indicators
The Houston PMI is based on diffusion indices for eight underlying indicators. The net value of each indicator is simply the percentage of respondents who cite a positive shift from the previous month minus the percentage who cite a negative shift. The diffusion index is calculated based on the percent of respondents reporting higher results plus one-half of those responding the same with seasonal adjustments to the Sales/New Orders, Production, Employment, and Prices Paid indices based on an X13 ARIMA forecast. Values above 50 for Sales/New Orders, Production, Employment, Prices Paid, and Lead Times generally point towards expansion and values below 50 signal contraction. Note that the Prices Paid Index may not follow this trend late in an economic expansion. The Inventory measures have an inverse correlation at most forecast horizons, meaning that values below 50 point to expansion and values above point to contraction. The Purchases index is inversely correlated with economic activity at the three-month forecast horizon.
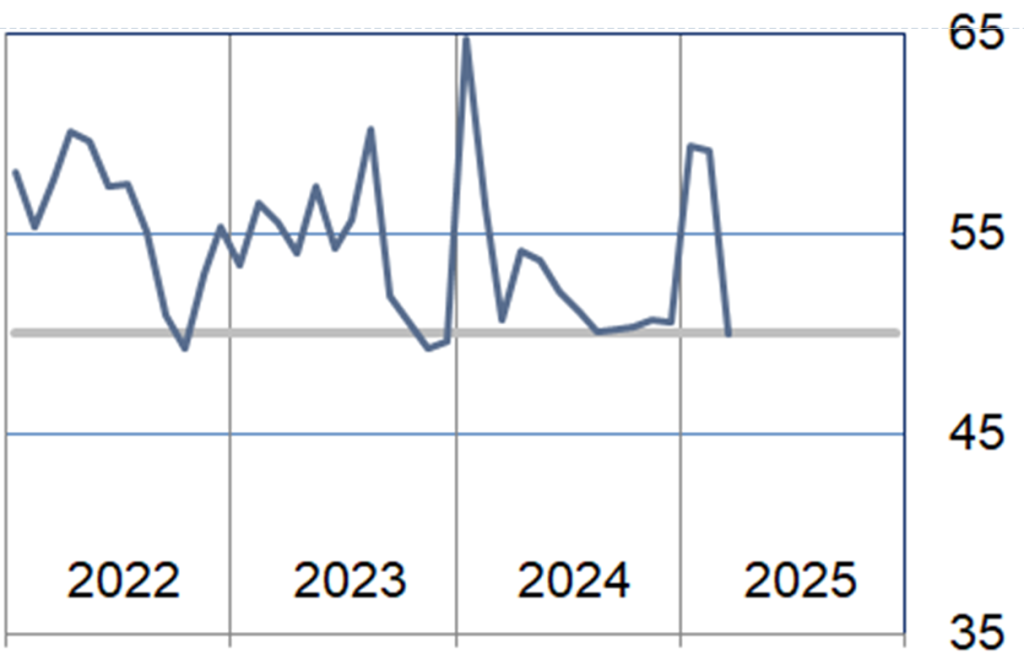
Sales/New Orders (Seasonally Adjusted)
The sales/new orders index fell below neutral in March with manufacturing expanding at a slow pace and nonmanufacturing reporting contraction for the first time in 17 months.
| Higher | Same | Lower | Net | Index | |
| Oct/24 | 18% | 74% | 8% | 10% | 57.1 |
| Nov/24 | 19% | 74% | 7% | 12% | 59.8 |
| Dec/24 | 18% | 76% | 6% | 12% | 58.2 |
| Jan/25 | 22% | 74% | 4% | 18% | 57.3 |
| Feb/25 | 16% | 81% | 3% | 13% | 53.6 |
| Mar/25 | 14% | 74% | 12% | 2% | 49.4 |
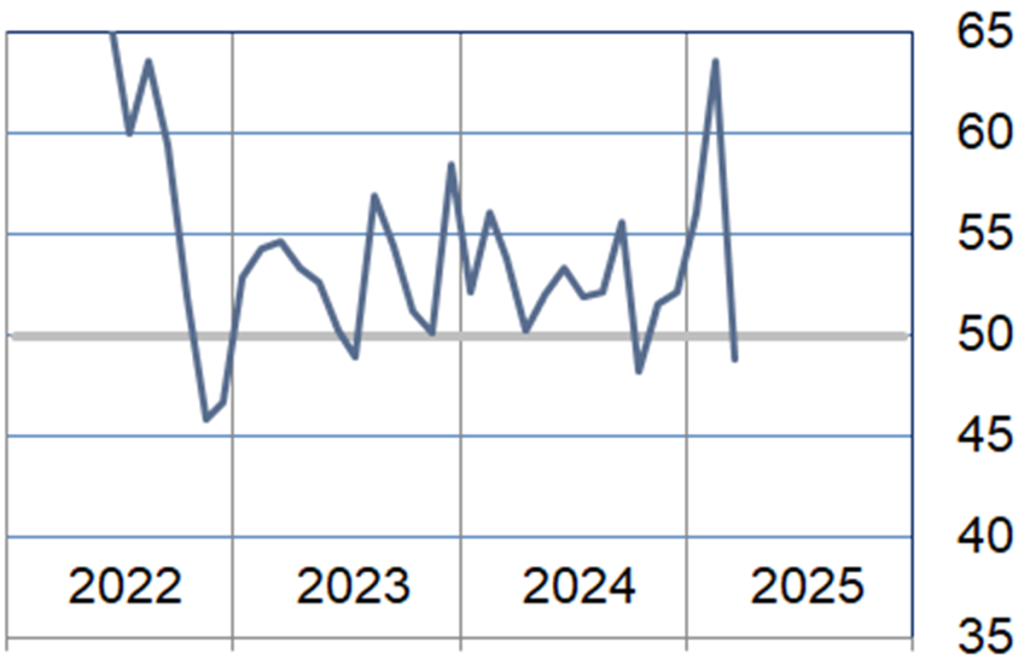
Production Index (Seasonally Adjusted)
The production index fell below neutral with manufacturing expanding at a very modest rate and nonmanufacturing running modestly below neutral.
| Higher | Same | Lower | Net | Index | |
| Oct/24 | 8% | 89% | 3% | 5% | 51.5 |
| Nov/24 | 14% | 80% | 6% | 8% | 56.1 |
| Dec/24 | 10% | 85% | 5% | 5% | 52.9 |
| Jan/25 | 13% | 82% | 5% | 8% | 53.2 |
| Feb/25 | 6% | 91% | 3% | 3% | 50.6 |
| Mar/25 | 8% | 85% | 7% | 1% | 49.2 |
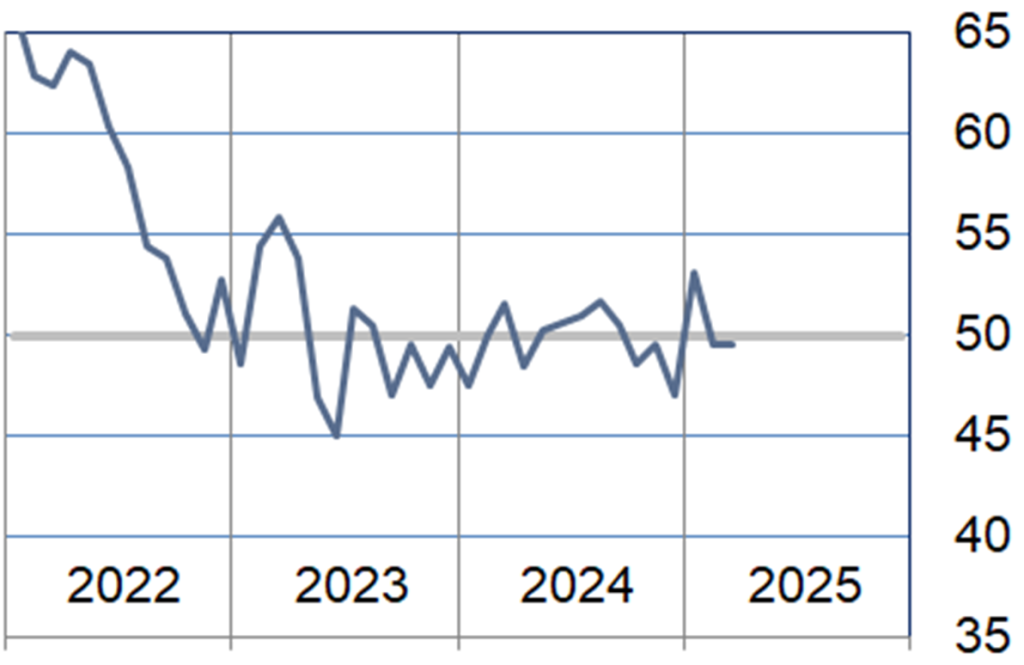
Employment Index (Seasonally Adjusted)
The employment index rose just above neutral with manufacturing continuing to show significant weakness and non-manufacturing rising back above neutral.
| Higher | Same | Lower | Net | Index | |
| Oct/24 | 4% | 80% | 16% | -12% | 43.4 |
| Nov/24 | 8% | 85% | 7% | 1% | 50.7 |
| Dec/24 | 6% | 91% | 3% | 3% | 50.3 |
| Jan/25 | 3% | 94% | 3% | 0% | 48.5 |
| Feb/25 | 2% | 93% | 5% | -3% | 47.5 |
| Mar/25 | 9% | 83% | 8% | 1% | 50.4 |
Purchases Index (Not Seasonally Adjusted)
The purchases index fell significantly to end at neutral. Non-manufacturing contracted at a modest rate and manufacturing expanded at a strong pace.
| Higher | Same | Lower | Net | Index | |
| Oct/24 | 9% | 83% | 8% | 1% | 50.3 |
| Nov/24 | 9% | 84% | 7% | 2% | 50.7 |
| Dec/24 | 7% | 87% | 6% | 1% | 50.6 |
| Jan/25 | 25% | 73% | 2% | 23% | 59.4 |
| Feb/25 | 23% | 75% | 2% | 21% | 59.2 |
| Mar/25 | 11% | 80% | 9% | 2% | 50.0 |
Prices Paid Index (Seasonally Adjusted)
The prices paid index also fell significantly to below neutral. Manufacturing continued to report significant strength, but this was offset by non-manufacturing falling to a level indicating strong contraction.
| Higher | Same | Lower | Net | Index | |
| Oct/24 | 3% | 95% | 2% | 1% | 48.3 |
| Nov/24 | 9% | 87% | 4% | 5% | 51.6 |
| Dec/24 | 13% | 82% | 5% | 8% | 52.2 |
| Jan/25 | 15% | 83% | 2% | 13% | 56.1 |
| Feb/25 | 33% | 65% | 2% | 31% | 63.5 |
| Mar/25 | 13% | 76% | 11% | 2% | 48.8 |
Lead Times Index (Not Seasonally Adjusted)
The lead times index remained relatively flat. Manufacturing continued to show strong expansion while non-manufacturing reported below neutral.
| Higher | Same | Lower | Net | Index | |
| Oct/24 | 2% | 93% | 5% | -3% | 48.6 |
| Nov/24 | 3% | 93% | 4% | -1% | 49.6 |
| Dec/24 | 2% | 90% | 8% | -6% | 47.0 |
| Jan/25 | 5% | 91% | 4% | 1% | 53.2 |
| Feb/25 | 3% | 95% | 2% | 1% | 49.5 |
| Mar/25 | 8% | 89% | 3% | 5% | 49.6 |
Purchased Inventory Index (Not Seasonally Adjusted)
The purchased inventory index fell back below neutral with both nonmanufacturing and manufacturing reporting at this level.
| Higher | Same | Lower | Net | Index | |
| Oct/24 | 4% | 89% | 7% | -3% | 48.6 |
| Nov/24 | 2% | 94% | 4% | -2% | 48.8 |
| Dec/24 | 2% | 91% | 7% | -5% | 47.5 |
| Jan/25 | 5% | 93% | 2% | 3% | 49.6 |
| Feb/25 | 6% | 87% | 7% | -1% | 51.2 |
| Mar/25 | 6% | 87% | 7% | -1% | 47.8 |

Finished Goods Inventory Index (Not Seasonally Adjusted)
The finished goods inventory index returned to modest expansion with manufacturing reporting well above neutral and non-manufacturing just above neutral.
| Higher | Same | Lower | Net | Index | |
| Oct/24 | 4% | 91% | 5% | -1% | 49.3 |
| Nov/24 | 3% | 93% | 4% | -1% | 49.1 |
| Dec/24 | 2% | 94% | 4% | -2% | 48.7 |
| Jan/25 | 5% | 93% | 2% | 3% | 51.4 |
| Feb/25 | 6% | 88% | 6% | 0% | 49.9 |
| Mar/25 | 7% | 91% | 2% | 5% | 52.5 |
Background on the ISM-Houston Business Report and HPMI Calculation Methods
The Houston Purchasing Managers Index has been included as an integral part of the ISM-Houston Business Report since the Houston chapter of the Institute for Supply Management started publication of this document in January 1995. The report and index are published monthly as the primary deliverables from a survey of Houston area Supply Chain leaders regarding the status of key activities believed to provide insight into the strength of the economy. The respondents come from diverse organizations including construction, energy, engineering, health care, durable and non-durable goods manufacturing, financial and business services, wholesale and retail trade, and utilities related companies.
The Houston Purchasing Managers Index is determined from diffusion indices of the eight indicators of economic activity covered by the ISM-Houston Business Survey and Report. These underlying indicators are sales or new orders, production, employment, purchases, prices paid for major purchases, lead times from sellers, purchased materials inventory (raw materials and supplies), and finished goods inventories. The respondents to the survey report the direction of each these activities as either up, the same or down in comparison to the previous month. An index for each of these areas is then calculated by subtracting the percentage of respondents that sight a negative shift from the percentage that sight a positive shift. For indicators that are positively correlated with economic growth, this results in an underlying index that points to expansion when it is above zero. Indicators that are negatively correlated with growth point to expansion when they are below zero.
The final Houston PMI is calculated by applying optimal regression factors to each of the eight underlying indicators noted above. These regression factors are determined using standard regression techniques comparing these underlying indicators to the Houston-The Woodlands-Sugar Land Business Cycle Index (Houston BCI), which is reported on a monthly basis by the Federal Reserve Bank of Dallas. This top-level index is converted to a 0 to 100 scale to match that of the national Purchasing Managers Index® (PMI®) which is published monthly by the Institute for Supply Management® (ISM®). Readings over 50 for the HPMI generally indicate manufacturing expansion in the Houston in the near term and readings below 50 show coming manufacturing contraction.
It is important to note that the manufacturing breakeven HPMI does not equate to the breakeven point for the overall Houston economy. ISM-Houston periodically reviews the capability of its correlations and adjusts the regression factors when appropriate. The most recent revision occurred as a result of a review undertaken during the third quarter of 2018, which determined that changes in the Houston economy over the last decade have shifted the intercept of the correlation, causing a neutral Houston PMI to no longer align with a neutral Houston BCI. A Houston PMI of 45 points now equates to a neutral Houston economy as measured by the Houston BCI. A similar offset between the National PMI and the National economy has existed for some time.
Use of ISM-Houston Business Report Content
All information contained in this report is protected by copyright laws and ISM-Houston retains all rights to this Content. ISM-Houston hereby grants you a limited, revocable license to access, print, and display this Content solely for your personal, non-commercial use. Requests for permission to reproduce or redistribute ISM-Houston Business Report Content can be made by contacting the ISM-Houston Business Survey Committee at hpmi@ism-houston.org.
ISM-Houston shall not have any liability, duty, or obligation for or relating to the ISM-Houston Business Report Content or other information contained herein, any errors, inaccuracies, omissions or delays in providing any ISM-Houston Business Report Content, or for any actions taken in reliance thereon. In no event shall ISM-Houston be liable for any special, incidental, or consequential damages, arising out of the use of the ISM-Houston Business Report.