
For release April 10, 2024
March ISM-Houston Business Report
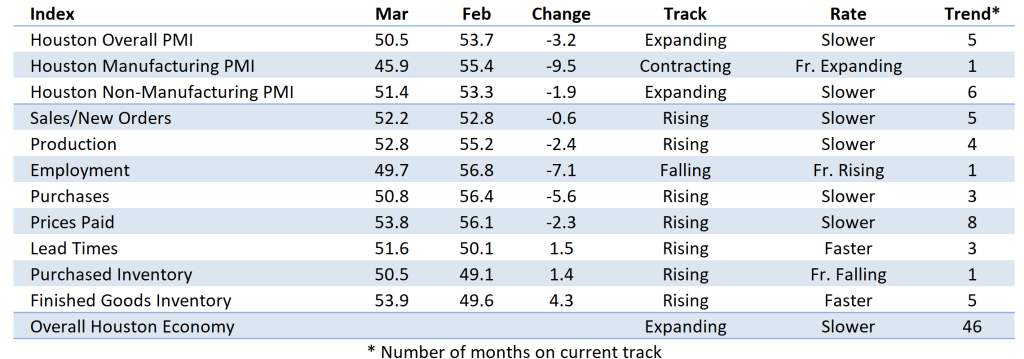
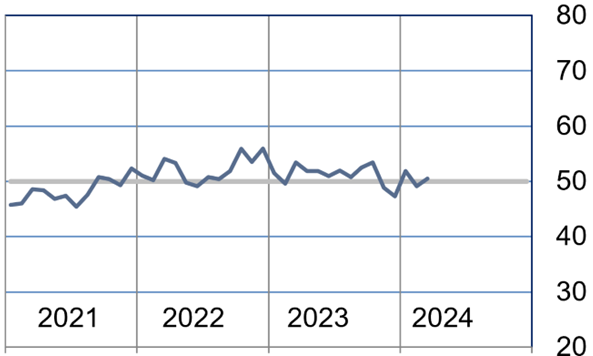
Houston PMI at 50.5 (down 3.2 points)
Sales/New Orders Expanding
Production Expanding
Employment Contracting
Prices Paid Expanding
Lead Times Expanding
Finished Goods Inventories Expanding
(Houston, Texas) – According to Houston area supply chain executives economic activity in Houston showed mixed results in March. The overall PMI expanded at a slower pace, with the nonmanufacturing sector expanding and the manufacturing sector indicating significant contraction.
The Houston Purchasing Managers Index expanded at a slower rate, down 3.2 points to 50.5. Sales/New Order and lead times, two of three indicators with a strong positive correlation with economic activity, saw expansion. Sales/New orders expanded to 52.2 points. Lead times expanded to 51.6 points. Employment, the other indicator with strong positive correlation to economic activity saw slight contraction, coming in at 49.7 points. The finished goods inventory index, the underlying indicator that has the strongest inverse correlation with economic activity, expanded reaching 53.9 points.
The Houston Manufacturing PMI fell points to 45.9. The nonmanufacturing PMI fell 1.9 points to 51.4.
On an industry specific basis: technical services, utilities, and professional and management services reported strong expansion. Transportation and warehousing, durable goods manufacturing showed relative weakness.
Click here to see the PDF version of the full report.
Indices at a Glance
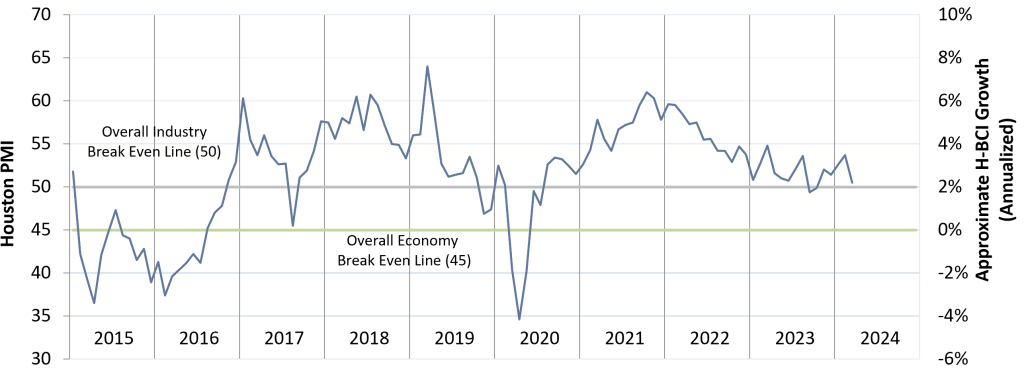
Houston PMI Trend
Houston PMI readings over 50 generally indicate that respondents see their activities as expanding. An HPMI above 45 normally correlates with expansion of the Houston-The Woodlands-Sugar Land Business Cycle Index (H-BCI).
Commodities Reported to have Notable Price Changes or to be in Short Supply
Up in Price: Specialty labor, regional labor, craft labor, commodity chemicals, stainless steel‡, transformers, switchgear, elastomers, offshore fabrication materials, electrical gear and components, electronics
Down in Price: Logistics services, steel, Oil Country Tubular Goods (OCTG), electronics‡, liquid natural gas, natural gas, fleet vehicles
In Short Supply: Craft labor, fluoropolymers (PFAs), resins, Inconel, offshore fabrication materials, electrical steel, electrical instrumentation, automation equipment, electrical gear, generators, electrical subcomponents, high voltage equipment, surgical instruments
‡ reported as up or down by different respondents
What our Respondents are Saying
Oil and Gas Exploration, and Key Support Services:
- This sector continues to contract this month at roughly the same rate as the previous month. The key drivers are dramatic contraction in the employment index and lead time. The production and sales indexes remain strong for this sector.
Construction:
- The Baltimore bridge collapse and existing shipping disruptions in the Red Sea are contributing to schedule and cost volatility for ocean cargos.
- Seeing a mixed bag for construction sectors, demand still good in many
- Long lead times for electrical equipment and electrical bulk materials remain a global challenge.
- This sector continues to show modest to strong growth. The employment and lead time indexes continue to show expansion with the sales index also moving into the significant expansion range. The prices paid index continues to expand for the third month in a row.
Durable Goods Manufacturing:
- Seeing concerns about getting new orders as it seems companies are not buying right now.
- This sector fell back into significant contraction in March. The performance is driven by significant contraction in the sales, production, employment and purchase indexes production, employment and purchase indexes.
Non-durable Goods Manufacturing:
- Facing uncertain future demand in Asian markets
- Mood at American Fuel and Petrochemical Manufacturers conference was optimistic across various meetings
- Sales are trending up
- This sector’s saw modest expansion in March driven rising sales/new orders, and production. Expansion was hampered by a weak employment index, which saw steep contraction.
Trade, Transportation, and Warehousing:
- No commodities identified in short supply; we have seen supply improvements.
- We expect inflationary pressures to persist as demand increase driven by our seasonal turnarounds and capital projects.
- This sector slight contraction in March, driven primarily by contraction in the sales an employment index. All indexes performed below February results.
Professional and Business Services:
- In the people business we continue to see a steady demand and supply situation. When we have either a contract staffing or direct hire opportunity and request from our clients, we continue to work hard to find qualified people willing to make a change. This has been the case for the past 8 months.
- Not many companies adding to staff and this makes the supply and demand equation very stable.
- We don’t expect salaries or hourly pay for Contractors to change very much over the next several months.
- In Houston, the market still continues to be a direct reflection of the price of oil and what the Majors (both oil companies and service companies) are willing to invest in regard to Staff. Don’t see a lot of hiring, but more filling spots with internal staff. Doesn’t mean that they are not looking to the outside, they do but not as much as a couple of years ago.
- This sector indicated strong expansion this month. The employment index indicated significant expansion with the sales/new orders index following suite. The purchase index moved sharply from expansion to contraction.
Health Care:
- Not seeing too many supply shortages, a function of not buying much capital equipment which is where we would see delays.
- In general, we are being asked for price increases all over. Especially in heavy labor components. Leveraging buying power in negotiations to keep prices steady. Flip side is we are seeing less cost reductions and more deals where price is not increasing.
- Final notice from CMS came down last Monday. All Healthcare providers and Insurers in the Medicare Advantage space are being impacted. More cost focus activities will be on the menu for now and 2025. This is the second notice out of 3.
- The sector reported slight expansion this month with all indexes indicating expansion. The purchased inventory and full goods inventory fell from significant expansion to just above neutral.
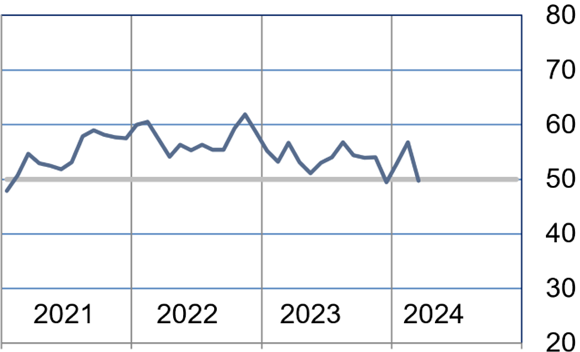
Trend of Underlying Indicators
The Houston PMI is based on diffusion indices for eight underlying indicators. The net value of each indicator is simply the percentage of respondents who cite a positive shift from the previous month minus the percentage who cite a negative shift. The diffusion index is calculated based on the percent of respondents reporting higher results plus one-half of those responding the same with seasonal adjustments to the Sales/New Orders, Production, Employment, and Prices Paid indices based on an X13 ARIMA forecast. Values above 50 for Sales/New Orders, Production, Employment, Prices Paid, and Lead Times generally point towards expansion and values below 50 signal contraction. Note that the Prices Paid Index may not follow this trend late in an economic expansion. The Inventory measures have an inverse correlation at most forecast horizons, meaning that values below 50 point to expansion and values above point to contraction. The Purchases index is inversely correlated with economic activity at the three-month forecast horizon.
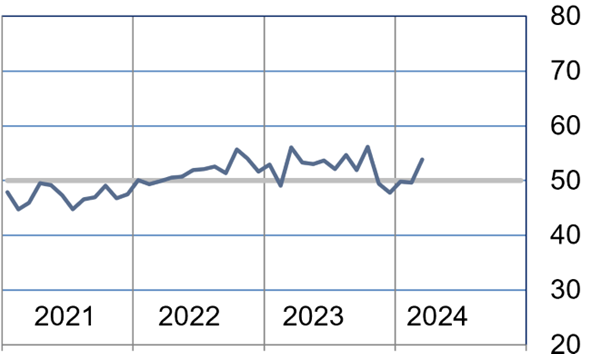
Sales/New Orders (Seasonally Adjusted)
The sales/new orders index expanded at a slower rate with slowing driven by both manufacturing and nonmanufacturing sector. Both still expanded, but at a slower rate than the previous month.
| Higher | Same | Lower | Net | Index | |
| Oct/23 | 5% | 79% | 16% | -11% | 46.6 |
| Nov/23 | 8% | 84% | 8% | 0% | 52.8 |
| Dec/23 | 7% | 87% | 6% | 1% | 55.1 |
| Jan/24 | 21% | 77% | 2% | 19% | 56.3 |
| Feb/24 | 14% | 80% | 6% | 8% | 52.8 |
| Mar/24 | 14% | 77% | 9% | 5% | 52.2 |
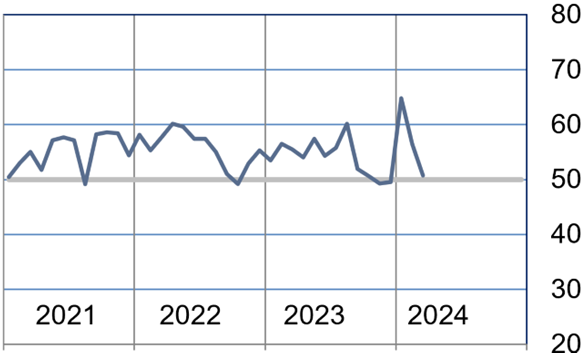
Production Index (Seasonally Adjusted)
The production index rose to show moderate expansion. Nonmanufacturing sectors continued to expand at a moderate rate while manufacturing sectors retreated from strong expansion to moderate.
| Higher | Same | Lower | Net | Index | |
| Oct/23 | 8% | 87% | 5% | 3% | 52.0 |
| Nov/23 | 5% | 88% | 7% | -2% | 49.9 |
| Dec/23 | 8% | 84% | 8% | 0% | 50.6 |
| Jan/24 | 13% | 86% | 1% | 12% | 56.1 |
| Feb/24 | 12% | 85% | 3% | 9% | 55.2 |
| Mar/24 | 9% | 86% | 5% | 4% | 52.8 |
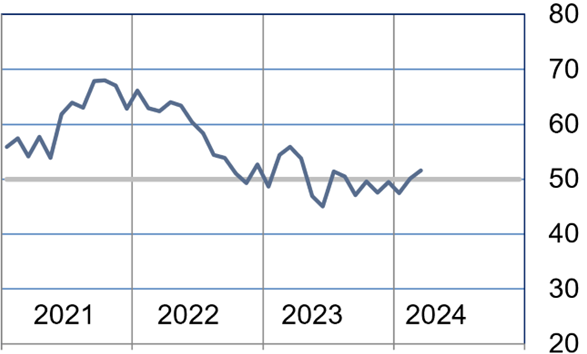
Employment Index (Seasonally Adjusted)
The employment index was the only index in contraction this month and it was driven by the manufacturing sector, switching from expanding to significant contraction. Nonmanufacturing was unchanged.
| Higher | Same | Lower | Net | Index | |
| Oct/23 | 7% | 91% | 2% | 5% | 53.9 |
| Nov/23 | 5% | 92% | 3% | 2% | 54.0 |
| Dec/23 | 4% | 89% | 7% | -3% | 49.4 |
| Jan/24 | 17% | 77% | 6% | 11% | 52.9 |
| Feb/24 | 15% | 79% | 6% | 9% | 56.8 |
| Mar/24 | 8% | 80% | 12% | -4% | 49.7% |
Purchases Index (Not Seasonally Adjusted)
The purchases index indicated slowing, but still expanded in March. The slowing was driven by slight contraction in the nonmanufacturing sector. The manufacturing sector was flat.
| Higher | Same | Lower | Net | Index | |
| Oct/23 | 16% | 69% | 15% | 1% | 50.6 |
| Nov/23 | 7% | 84% | 9% | -2% | 49.3 |
| Dec/23 | 8% | 83% | 9% | -1% | 49.6 |
| Jan/24 | 32% | 65% | 3% | 29% | 64.8 |
| Feb/24 | 17% | 79% | 4% | 13% | 56.4 |
| Mar/24 | 11% | 80% | 9% | 2% | 50.8 |
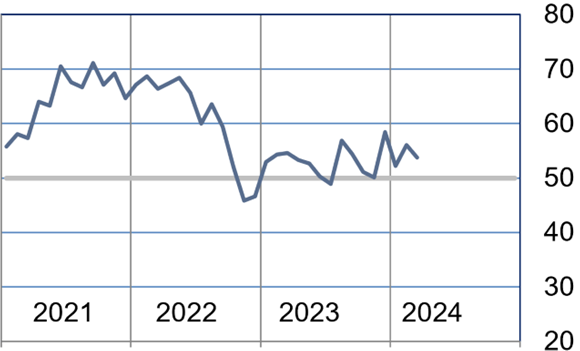
Prices Paid Index (Seasonally Adjusted)
The prices paid index indicated slower expansion in March. The manufacturing sector retreated from neutral falling to significant contraction. The nonmanufacturing sector saw minimal change.
| Higher | Same | Lower | Net | Index | |
| Oct/23 | 8% | 90% | 2% | 6% | 51.1 |
| Nov/23 | 3% | 92% | 5% | -2% | 50.2 |
| Dec/23 | 14% | 84% | 2% | 12% | 58.5 |
| Jan/24 | 11% | 83% | 6% | 5% | 52.2 |
| Feb/24 | 12% | 83% | 5% | 7% | 56.1 |
| Mar/24 | 12% | 84% | 4% | 8% | 53.8 |
Lead Times Index (Not Seasonally Adjusted)
The lead times index continued slight expansion in March. Both manufacturing and nonmanufacturing sectors expanded.
| Higher | Same | Lower | Net | Index | |
| Oct/23 | 6% | 87% | 7% | -1% | 49.5 |
| Nov/23 | 4% | 87% | 9% | -5% | 47.5 |
| Dec/23 | 3% | 93% | 4% | -1% | 49.5 |
| Jan/24 | 1% | 93% | 6% | -5% | 47.5 |
| Feb/24 | 4% | 92% | 4% | 0% | 50.1 |
| Mar/24 | 6% | 91% | 3% | 3% | 51.6 |
Purchased Inventory Index (Not Seasonally Adjusted)
The purchased inventory index expanded slightly in March. The expansion was driven by the manufacturing sector, which saw very strong expansion. The nonmanufacturing sector saw mild contraction.
| Higher | Same | Lower | Net | Index | |
| Oct/23 | 8% | 91% | 1% | 7% | 53.4 |
| Nov/23 | 3% | 91% | 6% | -3% | 48.8 |
| Dec/23 | 2% | 91% | 7% | -5% | 47.3 |
| Jan/24 | 5% | 93% | 2% | 3% | 51.8 |
| Feb/24 | 3% | 92% | 5% | -2% | 49.1 |
| Mar/24 | 8% | 85% | 7% | 1% | 50.5 |
Finished Goods Inventory Index (Not Seasonally Adjusted)
The finished goods inventory index saw moderate expansion. The nonmanufacturing sector indicated slower expansion while the manufacturing sector switched from contraction to significant expansion.
| Higher | Same | Lower | Net | Index | |
| Oct/23 | 13% | 86% | 1% | 12% | 56.1 |
| Nov/23 | 5% | 89% | 6% | -1% | 49.4 |
| Dec/23 | 4% | 88% | 8% | -4% | 47.7 |
| Jan/24 | 5% | 90% | 5% | 0% | 49.8 |
| Feb/24 | 5% | 90% | 5% | 0% | 49.6 |
| Mar/24 | 11% | 86% | 3% | 8% | 53.9 |
Background on the ISM-Houston Business Report and HPMI Calculation Methods
The Houston Purchasing Managers Index has been included as an integral part of the ISM-Houston Business Report since the Houston chapter of the Institute for Supply Management started publication of this document in January 1995. The report and index are published monthly as the primary deliverables from a survey of Houston area Supply Chain leaders regarding the status of key activities believed to provide insight into the strength of the economy. The respondents come from diverse organizations including construction, energy, engineering, health care, durable and non-durable goods manufacturing, financial and business services, wholesale and retail trade, and utilities related companies.
The Houston Purchasing Managers Index is determined from diffusion indices of the eight indicators of economic activity covered by the ISM-Houston Business Survey and Report. These underlying indicators are sales or new orders, production, employment, purchases, prices paid for major purchases, lead times from sellers, purchased materials inventory (raw materials and supplies), and finished goods inventories. The respondents to the survey report the direction of each these activities as either up, the same or down in comparison to the previous month. An index for each of these areas is then calculated by subtracting the percentage of respondents that sight a negative shift from the percentage that sight a positive shift. For indicators that are positively correlated with economic growth, this results in an underlying index that points to expansion when it is above zero. Indicators that are negatively correlated with growth point to expansion when they are below zero.
The final Houston PMI is calculated by applying optimal regression factors to each of the eight underlying indicators noted above. These regression factors are determined using standard regression techniques comparing these underlying indicators to the Houston-The Woodlands-Sugar Land Business Cycle Index (Houston BCI), which is reported on a monthly basis by the Federal Reserve Bank of Dallas. This top-level index is converted to a 0 to 100 scale to match that of the national Purchasing Managers Index® (PMI®) which is published monthly by the Institute for Supply Management® (ISM®). Readings over 50 for the HPMI generally indicate manufacturing expansion in the Houston in the near term and readings below 50 show coming manufacturing contraction.
It is important to note that the manufacturing breakeven HPMI does not equate to the breakeven point for the overall Houston economy. ISM-Houston periodically reviews the capability of its correlations and adjusts the regression factors when appropriate. The most recent revision occurred as a result of a review undertaken during the third quarter of 2018, which determined that changes in the Houston economy over the last decade have shifted the intercept of the correlation, causing a neutral Houston PMI to no longer align with a neutral Houston BCI. A Houston PMI of 45 points now equates to a neutral Houston economy as measured by the Houston BCI. A similar offset between the National PMI and the National economy has existed for some time.
Use of ISM-Houston Business Report Content
All information contained in this report is protected by copyright laws and ISM-Houston retains all rights to this Content. ISM-Houston hereby grants you a limited, revocable license to access, print, and display this Content solely for your personal, non-commercial use. Requests for permission to reproduce or redistribute ISM-Houston Business Report Content can be made by contacting the ISM-Houston Business Survey Committee at hpmi@ism-houston.org.
ISM-Houston shall not have any liability, duty, or obligation for or relating to the ISM-Houston Business Report Content or other information contained herein, any errors, inaccuracies, omissions or delays in providing any ISM-Houston Business Report Content, or for any actions taken in reliance thereon. In no event shall ISM-Houston be liable for any special, incidental, or consequential damages, arising out of the use of the ISM-Houston Business Report.