
(Houston, Texas) – According to Houston area supply chain executives, economic activity in Houston expanded for the month of June, breaking a three month trend of contraction. The shift was driven by moderate expansion in the nonmanufacturing sector. The manufacturing sector indicting a deeper contraction in June vs May. The overall economy expanded for the 61st month in a row.
The Houston Purchasing Managers Index expanded to 50.6 points. The lead time and sales/new order indexes, two of the three indicators with a strong positive correlation with the economy, expanded in the month of June. Lead time rose 2.2 points to 51.7 points, while sales/new orders rose 4.0 points to 53.6 points. The other index with strong positive correlation, employment, continued contracting in June however at a slower rate than the previous month. The employment index rose 3.0 points to 48.6 points. The finished goods inventory index, the underlying indicator that has the strongest inverse correlation with economic activity, increased 5.1 points to 53.1 points; switching from contraction to expansion.
The Houston manufacturing PMI fell 1.5 points during the month to 41.9 points; contracting at a faster rate than May. The nonmanufacturing PMI increased 3.2 points to 52.3 points.
On an industry specific basis, health care, trade, transportation and warehousing reported strong expansion. Nondurable goods manufacturing, durable goods and real estate indicated significant contraction.
Click here for the hard copy version of the report.
Indices at a Glance
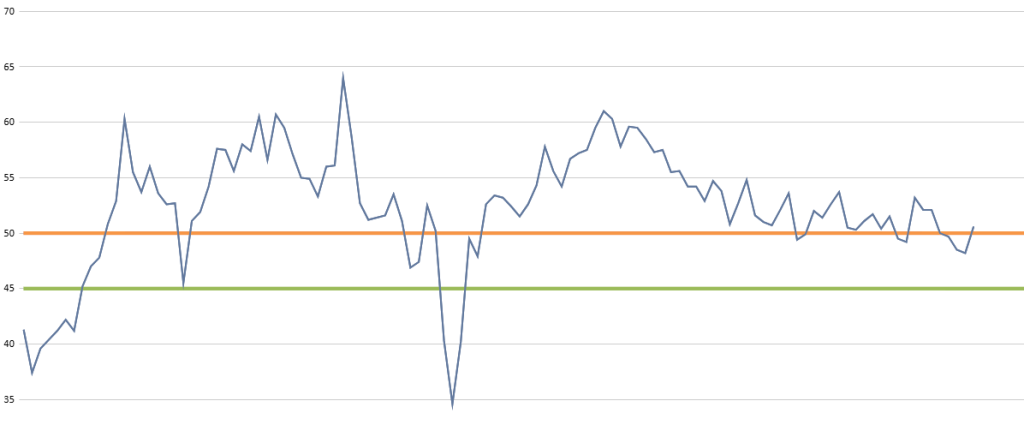
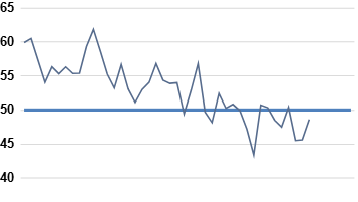
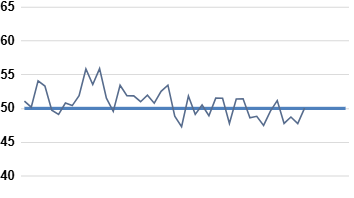
Houston PMI Trend
Houston PMI readings over 50 generally indicate that respondents see their activities as expanding. An HPMI above 45 normally correlates with expansion of the Houston-The Woodlands-Sugar Land Business Cycle Index (H-BCI).
Commodities Reported to have Notable Price Changes or to be in Short Supply
Up in Price: IT Services, consultant services, aluminum, copper, stainless steel, lined pipe, carbon steel flanges, fittings and valves, air compressors, cement, transformers, switchgear, circuit breakers, electrical equipment, measurement instruments, transmitters, gauges, flow meters, imported goods for resale
Down in Price: Oilfield drilling and completion services, diesel, natural gas, propane, gas liquids, ethane, oil country tubular goods, overland freight
In Short Supply: Skilled labor, transformers, switchgear, circuit breakers, electrical equipment, electrical components, automation equipment
‡ reported as up or down by different respondents
What our Respondents are Saying
Oil and Gas Exploration, and Key Support Services:
- Tarriff impacts still somewhat unknown
- 2h25 expecting flat to slightly lower service costs
- This sector saw slight expansion in June, reversing the trend of the past several months. The sales index indicated strong expansion along with production. The sector is still showing significant contraction in the employment, purchases and prices index
Construction:
- The unclear tariff situation and the existing tariffs had the consequence that a few clients have cancelled their projects. The additional cost of the tariffs makes the projects not feasible any more
- This sector switched from slight expansion back to contraction. The sales and purchases indexes saw significant contraction. The pricing index remains strong, expanding faster than May
Durable Goods Manufacturing:
- Tariffs continue to negatively affect pricing and availability
- Incoming orders are down due to a decrease in oil drilling activity and uncertainty regarding tariffs
- This sector slipped into significant contraction vs the slight contraction in May. The sales, purchases and employment indexes all indicate considerable contraction. The pricing index was very strong, expanding at a much higher rate vs May
Non-durable Goods Manufacturing:
- Olefins cracker feedstock prices remain low
- Refinery rates continue to rise as we approach the summer driving season
- This sector contracted at a slower rate in June vs May. The sales, production and purchases index contracted at a faster rate while employment contracted at a slower rate. Prices continues to see expansion and lead times are remaining steady
Wholesale and Retail Trade:
- Growth continues but more modest given Macro economic conditions
- This sector outperformed May results, expanding at a much faster rate. The sector saw expansion in all sectors except purchased inventory. The purchased inventory index contracted slightly
Health Care:
- In the healthcare sector, business continues to be steady. Aside from the political environment, it continues to be business as usual with minimal impact to operations or the availability of supplies
- This sector continues to indicate strong expansion, expanding at a faster rate than May. The sector indicated expansion in all indexes with sales, production, employment and purchases being very strong.
Professional and Business Services:
- US manufacturing is expected to remain mostly flat for the balance of the year due to trade issues, inflation concerns, and geopolitical uncertainty
- In the Houston area, much will be determined by how the Energy Companies view this year’s first half of the current administration (Federal) stance on Energy. With the prices of oil hovering in the $65/bbl range, many if not all energy companies are taking a wait and see attitude. Some (Apache, BP, Chevron, Dow, and others) have either had or announced reduction in staff. This is a sign that they are preparing for the price of oil to remain the same or dip slightly lower
- Pricing for labor continues to be flat. Even though the availability of qualified people exceeds the opportunities available, we are not seeing any significant reducing in what companies are willing to pay when they are hiring.
- This sector’s performance indicated slight expansion in June, with strong expansion in sales. The employment, purchased inventory and production index contracted slightly. All other indexes saw moderate expansion
Trend of Underlying Indicators
The Houston PMI is based on diffusion indices for eight underlying indicators. The net value of each indicator is simply the percentage of respondents who cite a positive shift from the previous month minus the percentage who cite a negative shift. The diffusion index is calculated based on the percent of respondents reporting higher results plus one-half of those responding the same with seasonal adjustments to the Sales/New Orders, Production, Employment, and Prices Paid indices based on an X13 ARIMA forecast. Values above 50 for Sales/New Orders, Production, Employment, Prices Paid, and Lead Times generally point towards expansion and values below 50 signal contraction. Note that the Prices Paid Index may not follow this trend late in an economic expansion. The Inventory measures have an inverse correlation at most forecast horizons, meaning that values below 50 point to expansion and values above point to contraction. The Purchases index is inversely correlated with economic activity at the three-month forecast horizon.
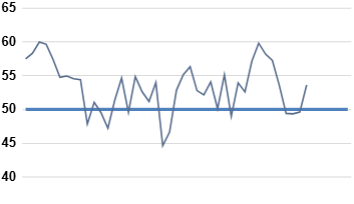
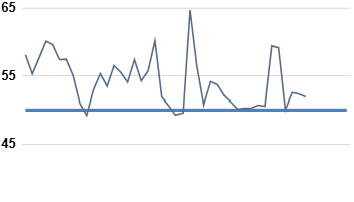
Sales/New Orders (Seasonally Adjusted)
The sales index expanded in June, driven by strong expansion in the nonmanufacturing sector. The manufacturing saw steep contraction and contracted faster vs May.
| Higher | Same | Lower | Net | Index | |
| Jan/25 | 22% | 74% | 4% | 18% | 57.3 |
| Feb/25 | 16% | 81% | 3% | 13% | 53.6 |
| Mar/25 | 14% | 74% | 12% | 2% | 49.4 |
| Apr/25 | 16% | 71% | 13% | 3% | 49.3 |
| May/25 | 15% | 75% | 10% | 5% | 49.6 |
| Jun/25 | 20% | 67% | 13% | 7% | 53.6 |
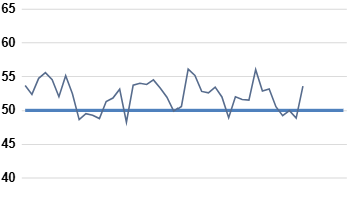
Production Index (Seasonally Adjusted)
The production index flipped from contraction to expansion in June. The shift was driven by the nonmanufacturing sector flipping from contraction to expansion. Manufacturing contracted slightly faster than May.
| Higher | Same | Lower | Net | Index | |
| Jan/25 | 13% | 82% | 5% | 8% | 53.2 |
| Feb/25 | 6% | 91% | 3% | 3% | 50.6 |
| Mar/25 | 8% | 85% | 7% | 1% | 49.2 |
| Apr/25 | 8% | 85% | 7% | 1% | 50.0 |
| May/25 | 6% | 88% | 6% | 0% | 48.9 |
| Jun/25 | 14% | 78% | 8% | 6% | 53.6 |
Employment Index (Seasonally Adjusted)
The employment index continued contracting in June however both the manufacturing and nonmanufacturing sectors contracted at slower rates vs May.
| Higher | Same | Lower | Net | Index | |
| Jan/25 | 3% | 94% | 3% | 0% | 48.5 |
| Feb/25 | 2% | 93% | 5% | -3% | 47.5 |
| Mar/25 | 9% | 83% | 8% | 1% | 50.4 |
| Apr/25 | 5% | 84% | 11% | -6% | 45.5 |
| May/25 | 9% | 75% | 16% | -7% | 45.6 |
| Jun/25 | 8% | 83% | 9% | -1% | 48.6 |
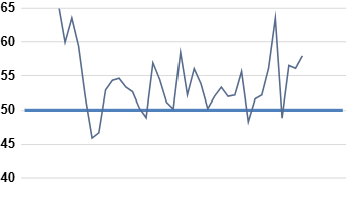
Purchases Index (Not Seasonally Adjusted)
The purchase index continues to expand, driven by more rapid expansion in nonmanufacturing. The manufacturing index saw deeper contraction vs May.
| Higher | Same | Lower | Net | Index | |
| Jan/25 | 25% | 73% | 2% | 23% | 59.4 |
| Feb/25 | 23% | 75% | 2% | 21% | 59.2 |
| Mar/25 | 11% | 80% | 9% | 2% | 50.0 |
| Apr/25 | 19% | 73% | 8% | 11% | 52.6 |
| May/25 | 16% | 76% | 8% | 8% | 52.3 |
| Jun/25 | 14% | 75% | 11% | 3% | 51.9 |
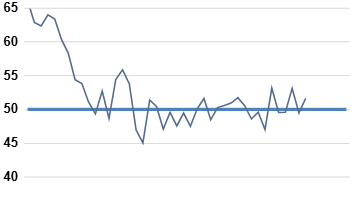
Prices Paid Index (Seasonally Adjusted)
The prices paid index continues to indicate strong expansion. It was driven by more rapid expansion in both manufacturing and nonmanufacturing.
| Higher | Same | Lower | Net | Index | |
| Jan/25 | 15% | 83% | 2% | 13% | 56.1 |
| Feb/25 | 33% | 65% | 2% | 31% | 63.5 |
| Mar/25 | 13% | 76% | 11% | 2% | 48.8 |
| Apr/25 | 18% | 79% | 3% | 15% | 56.5 |
| May/25 | 17% | 80% | 3% | 14% | 56.1 |
| Jun/25 | 18% | 78% | 4% | 14% | 57.9 |
Lead Times Index (Not Seasonally Adjusted)
The lead time index indicated slight expansion in June. Both the manufacturing and nonmanufacturing sectors saw expansion.
| Higher | Same | Lower | Net | Index | |
| Jan/25 | 5% | 91% | 4% | 1% | 53.2 |
| Feb/25 | 3% | 95% | 2% | 1% | 49.5 |
| Mar/25 | 8% | 89% | 3% | 5% | 49.6 |
| Apr/25 | 11% | 87% | 2% | 9% | 53.1 |
| May/25 | 4% | 93% | 3% | 1% | 49.5 |
| Jun/25 | 6% | 91% | 3% | 3% | 51.7 |
Purchased Inventory Index (Not Seasonally Adjusted)
The purchased inventory index was flat in June after three months of contraction. The manufacturing sector continues to contract while the nonmanufacturing sector flipped from contraction to expansion.
| Higher | Same | Lower | Net | Index | |
| Jan/25 | 5% | 93% | 2% | 3% | 49.6 |
| Feb/25 | 6% | 87% | 7% | -1% | 51.2 |
| Mar/25 | 6% | 87% | 7% | -1% | 47.8 |
| Apr/25 | 2% | 93% | 5% | -3% | 48.7 |
| May/25 | 2% | 94% | 4% | -2% | 47.7 |
| Jun/25 | 6% | 89% | 5% | 1% | 50.0 |

Finished Goods Inventory Index (Not Seasonally Adjusted)
The finished goods inventory expanded in June. The manufacturing sector flipped from contraction to slight expansion and the nonmanufacturing sector expanded at a moderate rate.
| Higher | Same | Lower | Net | Index | |
| Jan/25 | 5% | 93% | 2% | 3% | 51.4 |
| Feb/25 | 6% | 88% | 6% | 0% | 49.9 |
| Mar/25 | 7% | 91% | 2% | 5% | 52.5 |
| Apr/25 | 5% | 91% | 4% | 1% | 50.7 |
| May/25 | 2% | 92% | 6% | -4% | 48.0 |
| Jun/25 | 9% | 88% | 3% | 6% | 53.1 |
Projections for Key Long-Term Indicators
In addition to the current status of business activities, respondents to the ISM-Houston Business Survey also provide feedback on their view of the direction of the sales/new orders and employment indices six months into the future.
Six-Month Projection of the Sales/New Orders Index
The future sales index continued to indicate a continuing decline in the manufacturing sector. The nonmanufacturing sector indicated a slight improvement month over month.
| Higher | Same | Lower | Net | Index | |
| Jan/25 | 25% | 73% | 2% | 23% | 56.5 |
| Feb/25 | 23% | 75% | 2% | 21% | 47.8 |
| Mar/25 | 11% | 80% | 9% | 2% | 47.2 |
| Apr/25 | 19% | 73% | 8% | 11% | 48.9 |
| May/25 | 16% | 76% | 8% | 8% | 43.4 |
| Jun/25 | 14% | 75% | 11% | 3% | 41.9 |
Six Month Projection of Employment Index
The future employment index indicated expansion for June. The manufacturing sector contracted at a slower rate and the nonmanufacturing sector saw moderate expansion.
| Higher | Same | Lower | Net | Index | |
| Jan/25 | 13% | 82% | 5% | 8% | 51.3 |
| Feb/25 | 17% | 73% | 10% | 7% | 50.4 |
| Mar/25 | 19% | 71% | 10% | 9% | 50.2 |
| Apr/25 | 13% | 72% | 15% | -2% | 48.5 |
| May/25 | 12% | 75% | 13% | -1% | 49.1 |
| Jun/25 | 13% | 77% | 10% | 3% | 51.7 |
Background on the ISM-Houston Business Report and HPMI Calculation Methods
The Houston Purchasing Managers Index has been included as an integral part of the ISM-Houston Business Report since the Houston chapter of the Institute for Supply Management started publication of this document in January 1995. The report and index are published monthly as the primary deliverables from a survey of Houston area Supply Chain leaders regarding the status of key activities believed to provide insight into the strength of the economy. The respondents come from diverse organizations including construction, energy, engineering, health care, durable and non-durable goods manufacturing, financial and business services, wholesale and retail trade, and utilities related companies.
The Houston Purchasing Managers Index is determined from diffusion indices of the eight indicators of economic activity covered by the ISM-Houston Business Survey and Report. These underlying indicators are sales or new orders, production, employment, purchases, prices paid for major purchases, lead times from sellers, purchased materials inventory (raw materials and supplies), and finished goods inventories. The respondents to the survey report the direction of each these activities as either up, the same or down in comparison to the previous month. An index for each of these areas is then calculated by subtracting the percentage of respondents that sight a negative shift from the percentage that sight a positive shift. For indicators that are positively correlated with economic growth, this results in an underlying index that points to expansion when it is above zero. Indicators that are negatively correlated with growth point to expansion when they are below zero.
The final Houston PMI is calculated by applying optimal regression factors to each of the eight underlying indicators noted above. These regression factors are determined using standard regression techniques comparing these underlying indicators to the Houston-The Woodlands-Sugar Land Business Cycle Index (Houston BCI), which is reported on a monthly basis by the Federal Reserve Bank of Dallas. This top-level index is converted to a 0 to 100 scale to match that of the national Purchasing Managers Index® (PMI®) which is published monthly by the Institute for Supply Management® (ISM®). Readings over 50 for the HPMI generally indicate manufacturing expansion in the Houston in the near term and readings below 50 show coming manufacturing contraction.
It is important to note that the manufacturing breakeven HPMI does not equate to the breakeven point for the overall Houston economy. ISM-Houston periodically reviews the capability of its correlations and adjusts the regression factors when appropriate. The most recent revision occurred as a result of a review undertaken during the third quarter of 2018, which determined that changes in the Houston economy over the last decade have shifted the intercept of the correlation, causing a neutral Houston PMI to no longer align with a neutral Houston BCI. A Houston PMI of 45 points now equates to a neutral Houston economy as measured by the Houston BCI. A similar offset between the National PMI and the National economy has existed for some time.
Use of ISM-Houston Business Report Content
All information contained in this report is protected by copyright laws and ISM-Houston retains all rights to this Content. ISM-Houston hereby grants you a limited, revocable license to access, print, and display this Content solely for your personal, non-commercial use. Requests for permission to reproduce or redistribute ISM-Houston Business Report Content can be made by contacting the ISM-Houston Business Survey Committee at hpmi@ism-houston.org.
ISM-Houston shall not have any liability, duty, or obligation for or relating to the ISM-Houston Business Report Content or other information contained herein, any errors, inaccuracies, omissions or delays in providing any ISM-Houston Business Report Content, or for any actions taken in reliance thereon. In no event shall ISM-Houston be liable for any special, incidental, or consequential damages, arising out of the use of the ISM-Houston Business Report.