
For release July 10, 2023
June ISM-Houston Business Report
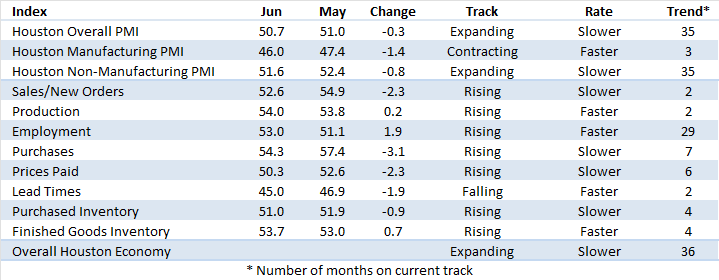
Houston PMI at 50.7 (down 0.3 points)
Sales/New Orders Expanding
Production Expanding
Employment Expanding
Prices Paid Expanding
Lead Times Contracting
Finished Goods Inventories Expanding
(Houston, Texas) – According to Houston area supply chain executives, economic activity in Houston expanded at slower pace in June. Manufacturing reported contraction at a faster pace and nonmanufacturing expanded at a modestly slower rate.
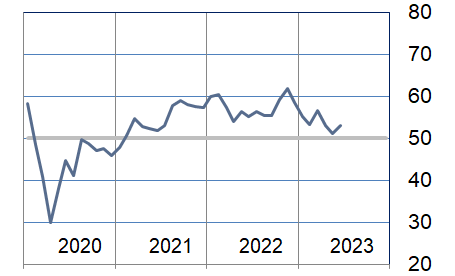
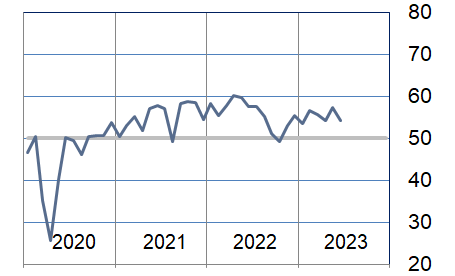
The Houston Purchasing Managers Index fell 0.3 points to 50.7. Two of the three underlying indicators that have the strongest positive correlation with the Houston economy (sales/new orders and employment) continue to point to modest to strong economic expansion. The third (lead times) indicated contraction for the second month. The sales/new orders index fell 2.3 points to 52.6. The employment index rose 1.9 points to 53.0. The lead times index fell an additional 1.9 points to 45.0. The finished goods inventory index, the underlying indicator that has the strongest inverse correlation with economic activity, rose 0.7 points to 53.7, giving a minimally stronger signal of potential economic contraction.
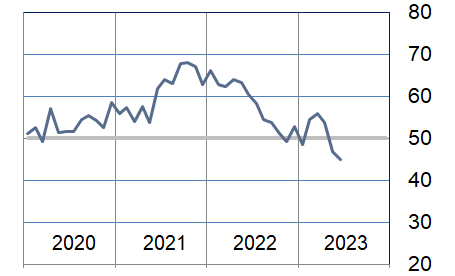
The Houston Manufacturing PMI fell 1.4 points to 46.0, continuing to provide a strong indication of potential overall economic contraction. The nonmanufacturing PMI fell 0.8 points to 51.6, showing a modestly lower expansion rate for the industries in this sector.
On an industry specific basis, trade, transportation & warehousing, construction, oil & gas, professional and management services, and health care reported modest expansion. Manufacturing, leisure and hospitality, and real estate continue to report low to moderate contraction.
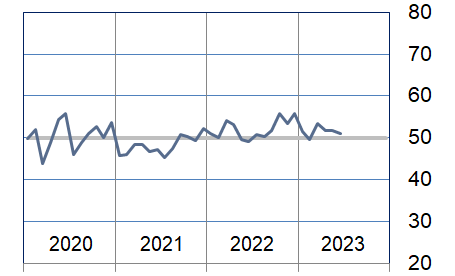
The Houston PMI provides a measure of current economic activity in the greater Houston area and a forecast of likely shifts in activity over a three-month forecast horizon. These indicators have a possible range of 0 to 100. Readings over 50 generally indicate goods producing industry expansion; readings below 50 show contraction. A PMI above 45 generally correlates with expansion of the Houston-The Woodlands-Sugar Land Business Cycle Index. The current and forecast PMI indices are based on diffusion indices for eight underlying indicators: Sales/New Orders, Production, Employment, Purchases, Prices Paid, Lead Times, Purchase Inventory, and Finished Goods Inventory.
The Houston PMI provides a measure of current economic activity in the greater Houston area and a forecast of likely shifts in activity over a three-month forecast horizon. These indicators have a possible range of 0 to 100. Readings over 50 generally indicate goods producing industry expansion; readings below 50 show contraction. A PMI above 45 generally correlates with expansion of the Houston-The Woodlands-Sugar Land Business Cycle Index. The current and forecast PMI indices are based on diffusion indices for eight underlying indicators: Sales/New Orders, Production, Employment, Purchases, Prices Paid, Lead Times, Purchase Inventory, and Finished Goods Inventory.
Click here to see the PDF version of the full report.
Indices at a Glance
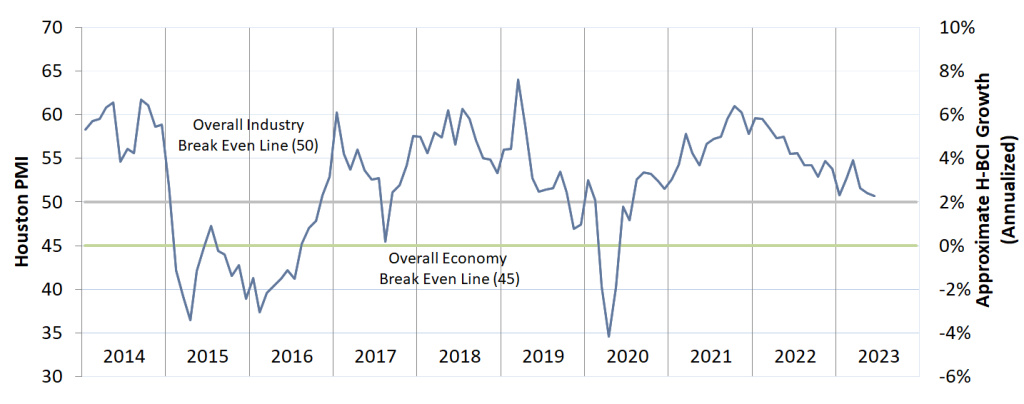
Houston PMI Trend
Houston PMI readings over 50 generally indicate that respondents see their activities as expanding. An HPMI above 45 normally correlates with expansion of the Houston-The Woodlands-Sugar Land Business Cycle Index (H-BCI).
Commodities Reported to have Notable Price Changes or to be in Short Supply
Up in Price: General and craft labor, oil field services labor, software services; elastomers; ethane; electrical gear and components, process control equipment, pressure and temperature gauges, HVAC, cement, lumber‡.
Down in Price: Proppants; natural gas; natural gas liquids, propane, butane, isobutane, natural gasoline, naphtha; ethylene, propylene, polyethylene and polypropylene; platinum, rhodium, cobalt, titanium, magnesium; structural steel, carbon and alloy steel piping, lumber‡; transportation/freight services, ocean freight from China.
In Short Supply: Light industrial labor, oil field service labor, craft labor, professional services labor, senior consultants; fluoropolymers (PFAs); low temperature large diameter fittings, control valves, some mechanical equipment, transformers, generators, electrical gear, electrical components, power supplies; computer hardware.
‡ reported as up or down by different respondents
What our Respondents are Saying
Oil and Gas Exploration, and Key Support Services:
- With slight upward pressure in costs and WTI/Brent prices remaining at lower levels, profitability is squeezed.
- Seeing a slight rollover in pipe pricing, flat to slightly down.
- This sector continues to show very modest growth; the prices-paid index joined the production index indicating strength; the employment index pointed to minimal contraction; all other indices were reported near neutral.
Construction:
- Seeing a mixed bag for our construction sectors, but demand is still good in many.
- Global inflation has decreased, and the USD has strengthened against all major currencies.
- Demand for transformers remains high and the lead-times are significantly longer than historical durations.
- The price for shipping containers dropped once again and is significantly lower than the 10-year average.
- Performance in this sector improved modestly; the sales/new orders index rose to just above neutral while the employment index moved to showing expansion at a strong pace; the lead-time index fell further below neutral; all other indices came in near neutral.
Durable Goods Manufacturing:
- We continue to see steady demand for manufactured oilfield equipment through increasing sales orders.
- Price increases due to inflation, labor costs, energy, etc. are not as acute as they were 6-12 months ago.
- This sector’s performance moved further below neutral with the sales/new orders and purchases indices showing significant weakness; the employment index remained modestly below neutral; production was relatively flat but finished goods inventories continue to rise.
Non-durable Goods Manufacturing:
- The market for our key products is still flat to down.
- This sector’s performance improved to near neutral with a significant improvement in the employment index being partially offset by weakness in the sales/new orders, purchases, prices-paid, lead-time, and finished goods inventories indices.
Trade, Transportation, and Warehousing:
- Year to date passenger departures from the Houston Airport System are nearing the pre-pandemic peak seen in 2019.
- This sector’s performance improved to well above neutral; the employment and lead-time indices joined the sales/new orders and purchases indices showing strength.
Real-Estate Services:
- New home construction and sales appear to have leveled out and are now increasing.
- This sector’s performance remained modestly below neutral with industrial and retail real estate reporting near this level; home sales reported improvement; office real estate continued to show weakness.
Professional and Business Services:
- Demand for contract labor remained flat, likely due to summer vacations and holidays.
- There continues to be an equilibrium between job opportunities and the number of people looking for work with only isolated cases of more demand than supply for either very technical or highly specific jobs.
- Energy continues to be the primary driving force behind jobs in Houston.
- We continue to see consolidations in the oil field services community which are focused on improving effectiveness in a stabilized market.
- Hourly pay rates and annual salaries being offered continue to “level off”.
- This sector report expansion at a significantly slower pace; while the employment index continues to show strength, the prices-paid and lead-time indices showed considerable weakness.
Leisure and Hospitality:
- This sector’s performance remained near neutral with all indices reporting at this level.
Health Care:
- Non-acute Health Care continues to see strong growth; diversification is key to growth in health care.
- This sector reported continued expansion at a slower pace; the sales/new orders, employment, purchases, and prices-paid indices showed continued strength while the lead time and inventory indices showed considerable weakness.
Government:
- This sector’s performance remained below neutral with the employment index continuing to point to contraction; all other indices came in near neutral.
Trend of Underlying Indicators
The Houston PMI is based on diffusion indices for eight underlying indicators. The net value of each indicator is simply the percentage of respondents who cite a positive shift from the previous month minus the percentage who cite a negative shift. The diffusion index is calculated based on the percent of respondents reporting higher results plus one-half of those responding the same with seasonal adjustments to the Sales/New Orders, Production, Employment, and Prices Paid indices based on an X13 ARIMA forecast. Values above 50 for Sales/New Orders, Production, Employment, Prices Paid, and Lead Times generally point towards expansion and values below 50 signal contraction. Note that the Prices Paid Index may not follow this trend late in an economic expansion. The Inventory measures have an inverse correlation at most forecast horizons, meaning that values below 50 point to expansion and values above point to contraction. The Purchases index is inversely correlated with economic activity at the three-month forecast horizon.
Sales/New Orders (Seasonally Adjusted)
The sales/new orders index expanded at a slower rate during the month. Nonmanufacturing performance was relatively unchanged while manufacturing is now showing significant contraction.
| Higher | Same | Lower | Net | Index | |
| Jan/23 | 7% | 85% | 8% | -1% | 47.2 |
| Feb/23 | 10% | 85% | 5% | 5% | 51.4 |
| Mar/23 | 17% | 76% | 7% | 10% | 54.7 |
| Apr/23 | 12% | 81% | 7% | 5% | 49.6 |
| May/23 | 19% | 75% | 6% | 13% | 54.9 |
| Jun/23 | 11% | 80% | 9% | 2% | 52.9 |
Production Index (Seasonally Adjusted)
The production index was relatively unchanged. Nonmanufacturing performance expanded at a faster rate while manufacturing showed significant contraction.
| Higher | Same | Lower | Net | Index | |
| Jan/23 | 9% | 84% | 7% | 2% | 51.3 |
| Feb/23 | 9% | 86% | 5% | 4% | 51.8 |
| Mar/23 | 13% | 80% | 7% | 6% | 53.2 |
| Apr/23 | 9% | 85% | 6% | 3% | 48.2 |
| May/23 | 11% | 86% | 3% | 8% | 53.8 |
| Jun/23 | 11% | 83% | 6% | 5% | 54.0 |
Employment Index (Seasonally Adjusted)
The employment index improved modestly with both manufacturing and nonmanufacturing reporting expansion at a similar pace.
| Higher | Same | Lower | Net | Index | |
| Jan/23 | 14% | 86% | 0% | 14% | 55.3 |
| Feb/23 | 13% | 81% | 6% | 7% | 53.2 |
| Mar/23 | 23% | 69% | 8% | 15% | 56.7 |
| Apr/23 | 18% | 78% | 4% | 14% | 53.1 |
| May/23 | 12% | 80% | 8% | 4% | 51.1 |
| Jun/23 | 15% | 80% | 5% | 10% | 53.0 |
Purchases Index (Not Seasonally Adjusted)
The purchases index pointed to expansion at a slower rate. Nonmanufacturing performance was relatively unchanged for this index. Manufacturing returned to showing a significant rate of contraction.
| Higher | Same | Lower | Net | Index | |
| Jan/23 | 10% | 87% | 3% | 7% | 53.4 |
| Feb/23 | 15% | 83% | 2% | 13% | 56.5 |
| Mar/23 | 16% | 79% | 5% | 11% | 55.5 |
| Apr/23 | 17% | 74% | 9% | 8% | 54.1 |
| May/23 | 19% | 77% | 4% | 15% | 57.4 |
| Jun/23 | 14% | 80% | 6% | 8% | 54.3 |
Prices Paid Index (Seasonally Adjusted)
The prices paid index fell to near neutral with both manufacturing and nonmanufacturing reporting at this level.
| Higher | Same | Lower | Net | Index | |
| Jan/23 | 7% | 91% | 2% | 5% | 52.9 |
| Feb/23 | 16% | 81% | 3% | 13% | 54.3 |
| Mar/23 | 24% | 69% | 7% | 17% | 54.6 |
| Apr/23 | 11% | 85% | 4% | 7% | 53.3 |
| May/23 | 13% | 78% | 9% | 4% | 52.6 |
| Jun/23 | 9% | 77% | 14% | -5% | 50.3 |
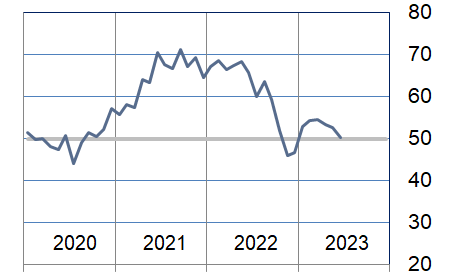
Lead Times Index (Not Seasonally Adjusted)
The lead times index fell again during the month indicating a faster rate of contraction. Manufacturing and nonmanufacturing reported this index as contracting at a similar rate.
| Higher | Same | Lower | Net | Index | |
| Jan/23 | 4% | 89% | 7% | -3% | 48.7 |
| Feb/23 | 13% | 82% | 5% | 8% | 54.4 |
| Mar/23 | 20% | 71% | 9% | 11% | 55.9 |
| Apr/23 | 12% | 83% | 5% | 7% | 53.8 |
| May/23 | 8% | 78% | 14% | -6% | 46.9 |
| Jun/23 | 5% | 80% | 15% | -10% | 45.0 |
Purchased Inventory Index (Not Seasonally Adjusted)
The purchased inventory index was relatively unchanged at just above neutral. Nonmanufacturing reported minimally higher expansion in this index while manufacturing reported significant contraction.
| Higher | Same | Lower | Net | Index | |
| Jan/23 | 4% | 95% | 1% | 3% | 51.5 |
| Feb/23 | 6% | 88% | 6% | 0% | 49.6 |
| Mar/23 | 10% | 86% | 4% | 6% | 53.4 |
| Apr/23 | 12% | 79% | 9% | 3% | 51.9 |
| May/23 | 8% | 88% | 4% | 4% | 51.9 |
| Jun/23 | 8% | 86% | 6% | 2% | 51.0 |
Finished Goods Inventory Index (Not Seasonally Adjusted)
The purchased inventory index was relatively unchanged at just above neutral. Nonmanufacturing reported minimally higher expansion in this index while manufacturing reported significant contraction.
| Higher | Same | Lower | Net | Index | |
| Jan/23 | 6% | 94% | 0% | 6% | 53.0 |
| Feb/23 | 5% | 89% | 6% | -1% | 49.1 |
| Mar/23 | 16% | 80% | 4% | 12% | 56.1 |
| Apr/23 | 11% | 85% | 4% | 7% | 53.3 |
| May/23 | 9% | 88% | 3% | 6% | 53.0 |
| Jun/23 | 10% | 87% | 3% | 7% | 53.7 |
Background on the ISM-Houston Business Report and HPMI Calculation Methods
The Houston Purchasing Managers Index has been included as an integral part of the ISM-Houston Business Report since the Houston chapter of the Institute for Supply Management started publication of this document in January 1995. The report and index are published monthly as the primary deliverables from a survey of Houston area Supply Chain leaders regarding the status of key activities believed to provide insight into the strength of the economy. The respondents come from diverse organizations including construction, energy, engineering, health care, durable and non-durable goods manufacturing, financial and business services, wholesale and retail trade, and utilities related companies.
The Houston Purchasing Managers Index is determined from diffusion indices of the eight indicators of economic activity covered by the ISM-Houston Business Survey and Report. These underlying indicators are sales or new orders, production, employment, purchases, prices paid for major purchases, lead times from sellers, purchased materials inventory (raw materials and supplies), and finished goods inventories. The respondents to the survey report the direction of each these activities as either up, the same or down in comparison to the previous month. An index for each of these areas is then calculated by subtracting the percentage of respondents that sight a negative shift from the percentage that sight a positive shift. For indicators that are positively correlated with economic growth, this results in an underlying index that points to expansion when it is above zero. Indicators that are negatively correlated with growth point to expansion when they are below zero.
The final Houston PMI is calculated by applying optimal regression factors to each of the eight underlying indicators noted above. These regression factors are determined using standard regression techniques comparing these underlying indicators to the Houston-The Woodlands-Sugar Land Business Cycle Index (Houston BCI), which is reported on a monthly basis by the Federal Reserve Bank of Dallas. This top-level index is converted to a 0 to 100 scale to match that of the national Purchasing Managers Index® (PMI®) which is published monthly by the Institute for Supply Management® (ISM®). Readings over 50 for the HPMI generally indicate manufacturing expansion in the Houston in the near term and readings below 50 show coming manufacturing contraction.
It is important to note that the manufacturing breakeven HPMI does not equate to the breakeven point for the overall Houston economy. ISM-Houston periodically reviews the capability of its correlations and adjusts the regression factors when appropriate. The most recent revision occurred as a result of a review undertaken during the third quarter of 2018, which determined that changes in the Houston economy over the last decade have shifted the intercept of the correlation, causing a neutral Houston PMI to no longer align with a neutral Houston BCI. A Houston PMI of 45 points now equates to a neutral Houston economy as measured by the Houston BCI. A similar offset between the National PMI and the National economy has existed for some time.
Use of ISM-Houston Business Report Content
All information contained in this report is protected by copyright laws and ISM-Houston retains all rights to this Content. ISM-Houston hereby grants you a limited, revocable license to access, print, and display this Content solely for your personal, non-commercial use. Requests for permission to reproduce or redistribute ISM-Houston Business Report Content can be made by contacting the ISM-Houston Business Survey Committee at hpmi@ism-houston.org.
ISM-Houston shall not have any liability, duty, or obligation for or relating to the ISM-Houston Business Report Content or other information contained herein, any errors, inaccuracies, omissions or delays in providing any ISM-Houston Business Report Content, or for any actions taken in reliance thereon. In no event shall ISM-Houston be liable for any special, incidental, or consequential damages, arising out of the use of the ISM-Houston Business Report.