
For release July 11, 2022
June 2022 ISM-Houston Business Report
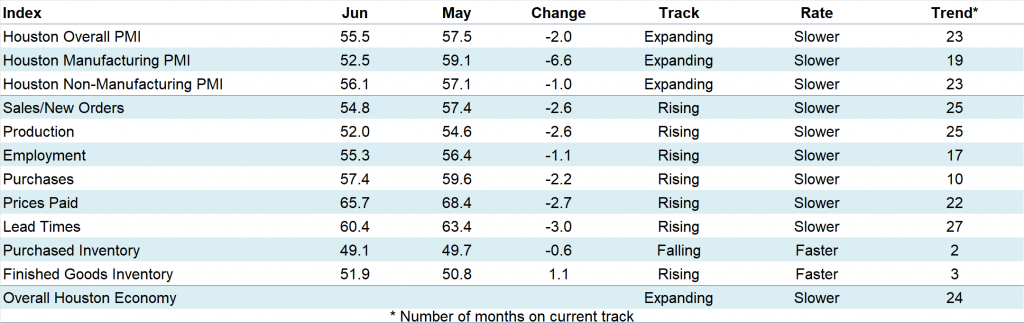
Houston PMI at 55.5 (down 2.0 points)
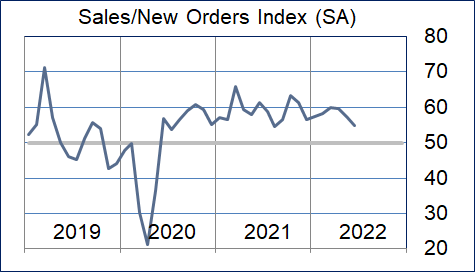
Sales/New Orders at 54.8 (down 2.6 points)
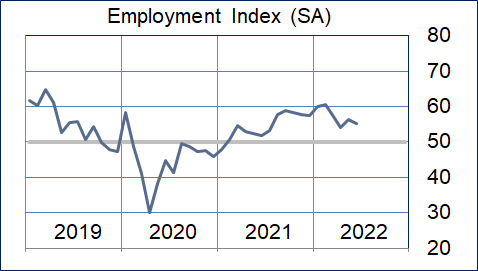
Employment at 55.3 (down 1.1 points)
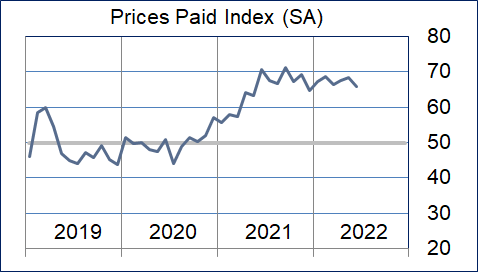
Prices Paid at 65.7 (down 2.7 points)
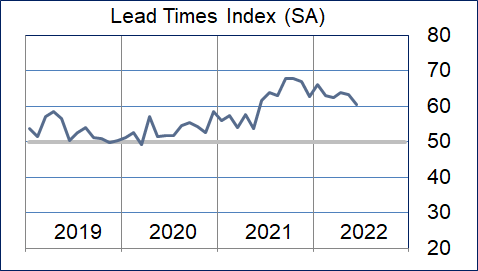
Lead Times at 60.4 (down 3.0 points)
Finished Goods Inventories at 51.9 (up 1.1 points)
(Houston, Texas) – According to Houston area supply chain executives, economic activity in Houston expanded in June at a modestly slower rate than last month. Non-manufacturing activities expanded at minimally slower rate compared to last month. Manufacturing activities expanded at a noticeably lower pace.
The Houston Purchasing Managers Index fell 2.0 points to 55.5. Lower sales/new orders, employment, and lead times indices along with a higher finished goods inventory index drove this change. The first three of these indicators have the strongest direct correlation with economic activity in Houston. The sales/new orders index fell 2.6 points to 54.8, the employment index fell 1.1 points to 55.3, and the lead times index fell 3.0 points to 60.4. The Finished goods inventory index, the underlying indicator that has the strongest inverse correlation with economic activity, rose 1.1 points to 51.9, continuing to give a modest indication of contraction.
As noted earlier this year, ISM-Houston is now reporting separate indices for manufacturing and non-manufacturing industries in addition to the overall Houston Purchasing Managers Index. The HPMI forecast has been eliminated from this report. The Houston Manufacturing PMI fell 6.6 points to 52.5, pointing to much slower expansion. The non-manufacturing PMI fell 1.0 points to 56.1 showing modestly lower expansion for the industries in this sector.
On an industry specific basis healthcare, oil & gas extraction, construction, leisure and hospitality, professional and management services, and transportation, trade, and warehousing reported strong expansion. Manufacturing and real estate reported very modest expansion.
Click here for the hard copy version of the report.
Indices at a Glance
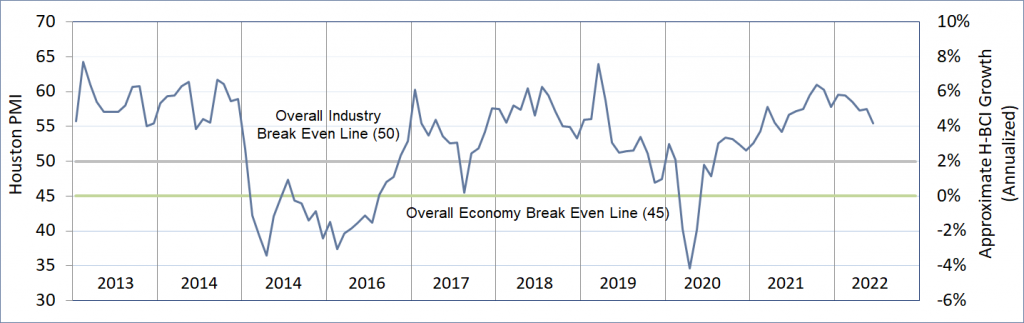
Houston PMI Trend
Houston PMI readings over 50 generally indicate that respondents see their activities as expanding. An HPMI above 45 normally correlates with expansion of the Houston-The Woodlands-Sugar Land Business Cycle Index (H-BCI).
Commodities Reported to have Notable Price Changes or to be in Short Supply
Up in Price: Skilled, unskilled, professional labor, frac crews; drilling rigs, oil country tubular goods (OCTG), oil field chemicals; crude oil, gasoline, diesel, jet fuel; caustic soda, propylene glycol, glycol ethers; carbon steel, electrical equipment/gear, transformers, high voltage cables, rotating equipment, some mechanical equipment, roofing, insulation; computer software and hardware, electronics, instrumentation; offshore vessels, rail and truck freight
Down in Price: Natural gas, ethane, propane, normal butane, natural gasoline, ethylene, propylene, triethylene glycol, benzene, toluene, xylene, PVC, polyethylene and polypropylene resins, palladium, rhodium, aluminum, copper, iron ore, nickel, cobalt, magnesium, carbon steel, lumber; ocean bulk material and container freight
In Short Supply: Light industrial labor, oil rig labor, frac crews, truck drivers, IT labor; diesel; caustic soda, sodium silicate, rubber compounds, rubber components, perfluoro alkoxy, propylene oxide; oil country tubular goods (OCTG), carbon steel, electrical power distribution equipment, electrical gear, some mechanical equipment, generators, roofing material, fabricated millwork; oil field chemicals; computer hardware
‡ reported as up or down by different respondents
What our Respondents are Saying
Oil and Gas Exploration, and Key Support Services:
- Continued tight oil supply is causing the acceleration of new projects
- Capital spending for new wells is picking up and rig counts are rising
- Attracting and retaining labor continues to be a challenge
- This sector expanded at a robust but slower pace with the production, employment, and prices paid indices falling modestly; all indices continue to be reported well above neutral
Construction:
- Project owners are cautious, backlog is good, but some sectors may slow due to the global slowdown and inflation
- Employee hiring and retention continues to be a challenge
- This sector expanded at a moderately slower rate; the sales/new orders index fell to neutral while the employment, purchases, prices paid, and lead times indices remained well above neutral
Durable Goods Manufacturing:
- We expect business activities to increase and product lead times to normalize as we enter the late months of the year
- This sector’s overall performance fell below neutral driven by significant contraction in the sales and production indices the prices paid and inventory indices remained well above neutral; all other indices were reported near neutral
Non-durable Goods Manufacturing:
- Starting to see indications of lead time improvement for MRO materials, but not across the board yet
- We expect to continue in a sold-out position for several months
- Carbon and alloy steel feed components (iron ore, chrome, nickel, cobalt, manganese, molybdenum) dropped in price in June and are continuing to fall in early July
- Prices for industrial metals (aluminum, copper, nickel, cobalt, manganese) have fallen significantly over the last quarter
- As of early July, we are seeing a similar trend for precious metals used for catalysts (gold, platinum, silver)
- Cracker feedstocks (ethane, propane, butane, natural gas liquids) have fallen in price by 5-15% over the last quarter and most petrochemical product prices are down by a similar amount
- This sector reported continued expansion at a significantly slower pace; the sales, production, employment, and inventory indices moved to neutral; the purchases, prices paid, and lead times indices continue to signal expansion
Trade, Transportation, and Warehousing:
- Russia continues to wreak havoc throughout the world
- Containerized ocean freight prices are now falling
- This sector remained above neutral with the prices paid and lead time indices continuing to show expansion; all other indices reported near neutral
Real-Estate Services:
- All indices and the overall performance for this sector came in near neutral; industrial and apartment related real-estate continues to point to modest expansion, while housing joined office real-estate in reporting modest contraction
Professional and Business Services:
- The job market remains strong across most industry sectors; talent demands are particularly strong in O&G
- Energy companies remain cautiously optimistic about investing in people and projects
- We continue to find ample sources of people for the job openings that are available
- We have seen prices of hourly contractors and direct hires stabilize over the past 30 days
- Fears of a recession linger but there has been minimal impact on demand for talent despite rising inflation
- This sector moderated during the month but continues to show expansion; the sales/new orders, employment, purchases, and prices paid indices expanded at a slower rate during the month, while all other indices were reported near neutral
Leisure and Hospitality:
- This sector moderated during the month driven by somewhat slower expansion in the employment index; the sales/new orders, prices paid, and lead times indicators continue to point to significant strength
Health Care:
- This sector reported expansion at a similar rapid pace to last month with all positively correlated indicators reporting robust expansion
Trend of Underlying Indicators
The Houston PMI is based on diffusion indices for eight underlying indicators. The net value of each indicator is simply the percentage of respondents who cite a positive shift from the previous month minus the percentage who cite a negative shift. The diffusion index is calculated based on the percent of respondents reporting higher results plus one-half of those responding the same with a seasonal adjustment based on an X13 ARIMA forecast. Values above 50 for Sales/New Orders, Production, Employment, Prices Paid, and Lead Times generally point towards expansion and values below 50 signal contraction. Note that the Prices Paid Index may not follow this trend late in an economic expansion. The Inventory measures have an inverse correlation at most forecast horizons, meaning that values below 50 point to expansion and values above point to contraction. The Purchases index is inversely correlated with economic activity at the three-month forecast horizon.
Sales/New Orders
The sales/new orders index fell. As with last month, weakening in manufacturing caused most of this decline led by a significant contraction in durable goods. Non-manufacturing expanded at a modestly lower rate.
| Higher | Same | Lower | Net | Index | |
| Jan/22 | 18% | 80% | 2% | 16% | 57.5 |
| Feb/22 | 21% | 78% | 1% | 20% | 58.3 |
| Mar/22 | 22% | 77% | 1% | 21% | 60.0 |
| Apr/22 | 24% | 75% | 1% | 23% | 59.7 |
| May/22 | 21% | 77% | 2% | 19% | 57.4 |
| Jun/22 | 14% | 82% | 4% | 10% | 54.8 |
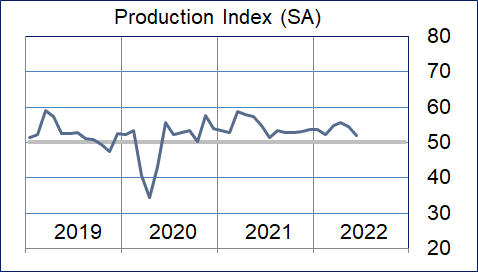
Production Index
The production index also fell, led by a significant decline in manufacturing. This index remained above neutral for nondurable goods but fell well below neutral for durable goods. It was relatively unchanged for the non-manufacturing sectors.
| Higher | Same | Lower | Net | Index | |
| Jan/22 | 10% | 89% | 1% | 9% | 53.7 |
| Feb/22 | 7% | 92% | 1% | 6% | 52.4 |
| Mar/22 | 11% | 88% | 1% | 10% | 54.8 |
| Apr/22 | 13% | 86% | 1% | 12% | 55.6 |
| May/22 | 12% | 87% | 1% | 11% | 54.6 |
| Jun/22 | 7% | 91% | 2% | 5% | 52.0 |
Employment Index
The employment index fell modestly led by declines in manufacturing. Transportation and trade joined oil and gas, construction, health care, and professional and business services in reporting significant strength.
| Jan/22 | 18% | 81% | 1% | 17% | 59.9 |
| Feb/22 | 21% | 78% | 1% | 20% | 60.5 |
| Mar/22 | 15% | 84% | 1% | 14% | 57.3 |
| Apr/22 | 15% | 83% | 2% | 13% | 54.1 |
| May/22 | 17% | 81% | 2% | 15% | 56.4 |
| Jun/22 | 15% | 84% | 1% | 14% | 55.3 |
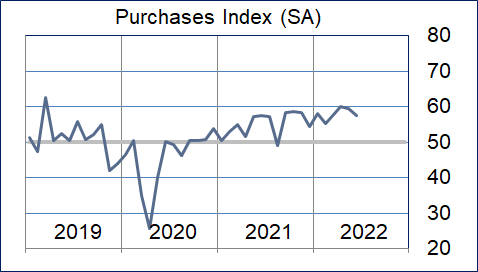
Purchases Index
The purchases index also fell a modest amount with both services and manufacturing reporting a small reduction in this index. Most sectors continue to indicate that this index is pointing to strong expansion.
| Jan/22 | 20% | 79% | 1% | 19% | 58.1 |
| Feb/22 | 11% | 88% | 1% | 10% | 55.3 |
| Mar/22 | 19% | 80% | 1% | 18% | 57.7 |
| Apr/22 | 22% | 77% | 1% | 21% | 60.1 |
| May/22 | 21% | 77% | 2% | 19% | 59.6 |
| Jun/22 | 19% | 79% | 2% | 17% | 57.4 |
Prices Paid Index
This month’s prices paid index points to robust expansion at a slower pace. As with the previous two months, a greater number of commodities were listed as down in price compared to the previous month.
| Higher | Same | Lower | Net | Index | |
| Jan/22 | 36% | 63% | 1% | 35% | 67.1 |
| Feb/22 | 39% | 60% | 1% | 38% | 68.7 |
| Mar/22 | 38% | 61% | 1% | 37% | 66.4 |
| Apr/22 | 41% | 58% | 1% | 40% | 67.4 |
| May/22 | 41% | 58% | 1% | 40% | 68.4 |
| Jun/22 | 33% | 65% | 2% | 31% | 65.7 |
Lead Times Index
The lead times index also fell during the month. The non-manufacturing sectors continue to report this index as expanding at a rapid pace. Manufacturing, particularly durable goods, reported it as expanding at a slower rate.
| Jan/22 | 32% | 64% | 4% | 28% | 66.2 |
| Feb/22 | 31% | 65% | 4% | 27% | 62.9 |
| Mar/22 | 31% | 64% | 5% | 26% | 62.4 |
| Apr/22 | 36% | 61% | 3% | 33% | 64.0 |
| May/22 | 33% | 63% | 4% | 29% | 63.4 |
| Jun/22 | 26% | 70% | 4% | 22% | 60.4 |
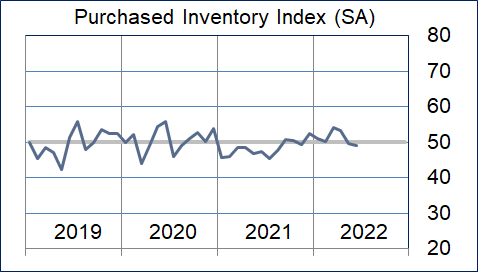
Purchased Inventory Index
The purchased inventory index remained near neutral. Health care and durable goods manufacturing reported these inventories as expanding at a rapid pace. Nondurable goods reported them as contracting at a fast pace.
| Higher | Same | Lower | Net | Index | |
| Jan/22 | 9% | 90% | 1% | 8% | 51.1 |
| Feb/22 | 7% | 90% | 3% | 4% | 50.2 |
| Mar/22 | 11% | 88% | 1% | 10% | 54.1 |
| Apr/22 | 10% | 88% | 2% | 8% | 53.3 |
| May/22 | 6% | 92% | 2% | 4% | 49.7 |
| Jun/22 | 7% | 86% | 7% | 0% | 49.1 |
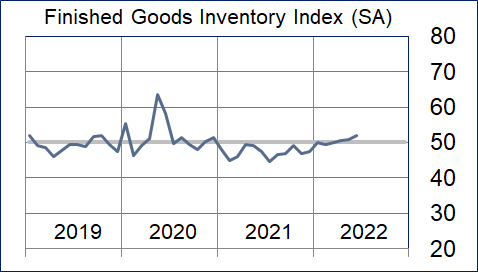
Finished Goods Inventory Index
The finished goods inventory index rose modestly. Durable goods manufacturing reported this index as expanding at a rapid pace again this month. All other sectors reported this index near neutral.
| Higher | Same | Lower | Net | Index | |
| Jan/22 | 8% | 89% | 3% | 5% | 50.0 |
| Feb/22 | 6% | 89% | 5% | 1% | 49.3 |
| Mar/22 | 5% | 89% | 6% | -1% | 49.9 |
| Apr/22 | 6% | 91% | 3% | 3% | 50.5 |
| May/22 | 5% | 91% | 4% | 1% | 50.8 |
| Jun/22 | 5% | 92% | 3% | 2% | 51.9 |
Background on the ISM-Houston Business Report and HPMI Calculation Methods
The Houston Purchasing Managers Index has been included as an integral part of the ISM-Houston Business Report since the Houston chapter of the Institute for Supply Management started publication of this document in January 1995. The report and index are published monthly as the primary deliverables from a survey of Houston area Supply Chain leaders regarding the status of key activities believed to provide insight into the strength of the economy. The respondents come from diverse organizations including construction, energy, engineering, health care, durable and non-durable goods manufacturing, financial and business services, wholesale and retail trade, and utilities related companies.
The Houston Purchasing Managers Index is determined from diffusion indices of the eight indicators of economic activity covered by the ISM-Houston Business Survey and Report. These underlying indicators are sales or new orders, production, employment, purchases, prices paid for major purchases, lead times from sellers, purchased materials inventory (raw materials and supplies), and finished goods inventories. The respondents to the survey report the direction of each these activities as either up, the same or down in comparison to the previous month. An index for each of these areas is then calculated by subtracting the percentage of respondents that sight a negative shift from the percentage that sight a positive shift. For indicators that are positively correlated with economic growth, this results in an underlying index that points to expansion when it is above zero. Indicators that are negatively correlated with growth point to expansion when they are below zero.
The final Houston PMI is calculated by applying optimal regression factors to each of the eight underlying indicators noted above. These regression factors are determined using standard regression techniques comparing these underlying indicators to the Houston-The Woodlands-Sugar Land Business Cycle Index (Houston BCI), which is reported on a monthly basis by the Federal Reserve Bank of Dallas. This top-level index is converted to a 0 to 100 scale to match that of the national Purchasing Managers Index® (PMI®) which is published monthly by the Institute for Supply Management® (ISM®). Readings over 50 for the HPMI generally indicate manufacturing expansion in the Houston in the near term and readings below 50 show coming manufacturing contraction.
It is important to note that the manufacturing breakeven HPMI does not equate to the breakeven point for the overall Houston economy. ISM-Houston periodically reviews the capability of its correlations and adjusts the regression factors when appropriate. The most recent revision occurred as a result of a review undertaken during the third quarter of 2018, which determined that changes in the Houston economy over the last decade have shifted the intercept of the correlation, causing a neutral Houston PMI to no longer align with a neutral Houston BCI. A Houston PMI of 45 points now equates to a neutral Houston economy as measured by the Houston BCI. A similar offset between the National PMI and the National economy has existed for some time.
Use of ISM-Houston Business Report Content
All information contained in this report is protected by copyright laws and ISM-Houston retains all rights to this Content. ISM-Houston hereby grants you a limited, revocable license to access, print, and display this Content solely for your personal, non-commercial use. Requests for permission to reproduce or redistribute ISM-Houston Business Report Content can be made by contacting the ISM-Houston Business Survey Committee at hpmi@ism-houston.org.
ISM-Houston shall not have any liability, duty, or obligation for or relating to the ISM-Houston Business Report Content or other information contained herein, any errors, inaccuracies, omissions or delays in providing any ISM-Houston Business Report Content, or for any actions taken in reliance thereon. In no event shall ISM-Houston be liable for any special, incidental, or consequential damages, arising out of the use of the ISM-Houston Business Report.