
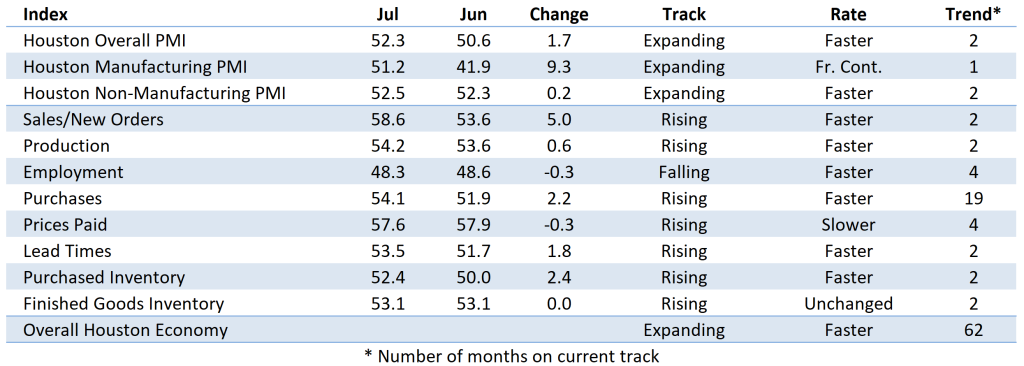
(Houston, Texas) – According to Houston area supply chain executives, economic activity in Houston continued to expand for the month of July. Both the manufacturing and non-manufacturing sectors saw expansion collectively for the first time since January. The overall economy expanded for the 62nd month in a row.
The Houston Purchasing Managers Index expanded to 52.3 points. The lead time and sales/new order indexes, two of the three indicators with a strong positive correlation with the economy, expanded in the month of July. Lead time rose1.8 points to 53.5 points, while sales/new orders rose 5.0 points to 58.6 points. The other index with strong positive correlation, employment, continued contracting in July, falling at a faster rate than June. The employment index fell 0.3 points to 48.3 points. The finished goods inventory index, the underlying indicator that has the strongest inverse correlation with economic activity, remained unchanged at 53.1 points.
The Houston manufacturing PMI index rose 9.3 points during the month to 51.2 points; expanding for the first time in 5 months. The nonmanufacturing PMI increased 0.2 points to 52.5 points.
On an industry specific basis: health care, trade, transportation and warehousing reported strong expansion. Management and administrative services indicated significant contraction.
https://www.ism-houston.org/wp-content/uploads/2025/08/ISM-Houston-Business-Report-2025-08-11-1.pdf
Indices at a Glance
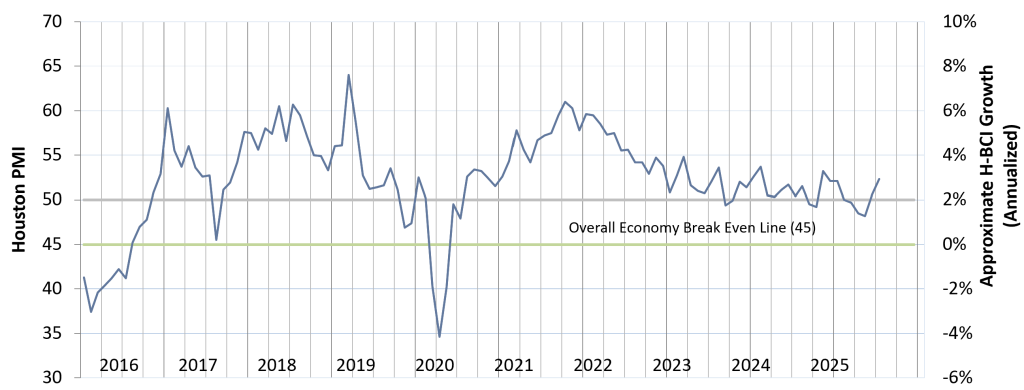
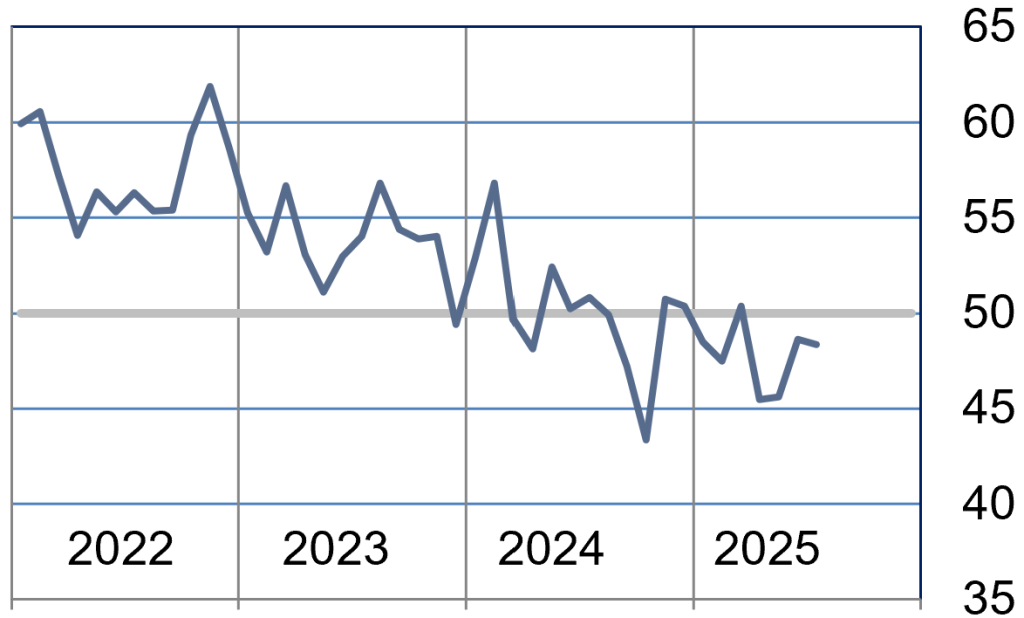
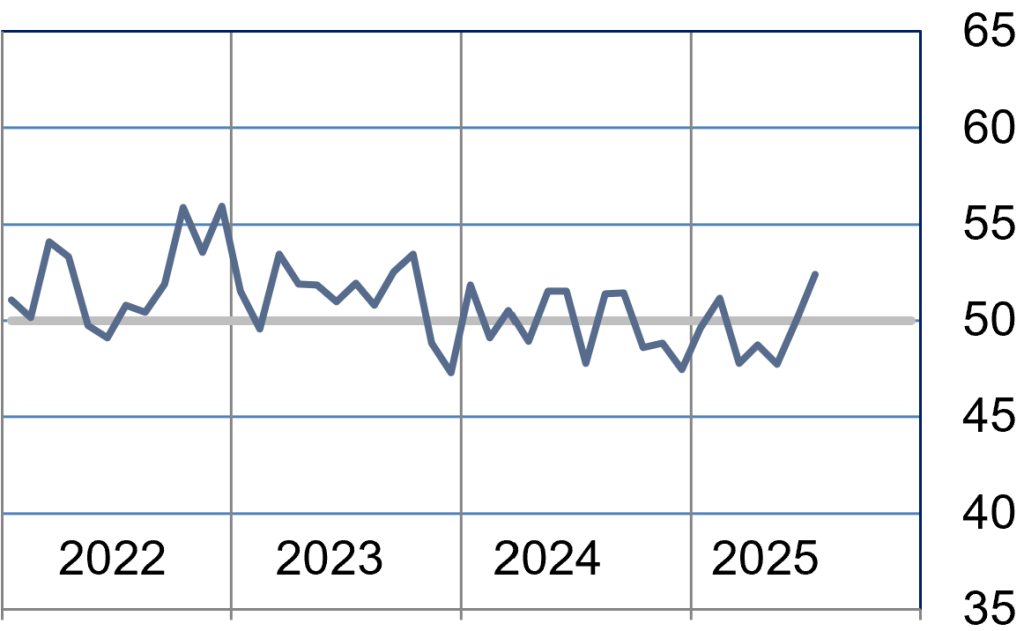
Houston PMI Trend
Houston PMI readings over 50 generally indicate that respondents see their activities as expanding. An HPMI above 45 normally correlates with expansion of the Houston-The Woodlands-Sugar Land Business Cycle Index (H-BCI).
Commodities Reported to have Notable Price Changes or to be in Short Supply
Up in Price: International logistics services, aluminum, copper, stainless steel, industrial hoses, low carbon steel casting, cement, computer software and hardware, transformers, switchgear, circuit breakers, electrical equipment, imported goods for resale
Down in Price: Logistic labor, process chemicals, copper, nickel, catalyst, bulk liquid storage, overland freight
In Short Supply: Skilled labor, melt stainless steel, cold rolled stainless steel, wire rod, transformers, switchgear, circuit breakers, electrical equipment, electrical components, automation equipment, regional overland freight logistics.
‡ reported as up or down by different respondents
What our Respondents are Saying
Oil and Gas Exploration, and Key Support Services:
- Way too much uncertainty on the market puts projects on hold
- Continued work to analyze and react to tariff announcements
- Port Congestion, Tariffs impacting plans and pricing
- In the Houston area, much will be determined by how the Energy Companies view this year’s first half of the current administration (Federal) stance on Energy. With the prices of oil hovering in the $65/bbl range, many if not all energy companies are taking a wait and see attitude. Some companies have already announced significant layoffs, and the thinking is that other companies will follow suit unless we see a significant increase in the price per BBO Equivalent.
- This sector saw slight contraction in July. The sales index indicated strong expansion, but employment is in steep contraction. The purchase and full goods inventory are also expanding sharply.
Construction:
- The unclear tariff situation makes it hard to predict price-developments
- This sector slipped flipped back to expansion from contraction. Performance was driven by employment, and sales flipping from contraction to expansion. The lead time index also saw dramatic expansion.
Durable Goods Manufacturing:
- This sector saw slower contraction in July vs June, with sales improving dramatically, however still contracting. The production index saw steep contraction while employment contracted at a slower rate.
Non-durable Goods Manufacturing:
- Feedstocks were flat. Labor is something we continue to monitor
- Seeing a reduction in incoming vessels in the bulk liquid space. Bulk liquid facilities are seeing reduced throughput and some tanks coming off lease due to geopolitical shifts
- This sector flipped from contraction to expansion in July. Each index indicated improvement vs June and only the employment and purchased inventory were in contraction.
Wholesale and Retail Trade:
- Hesitation to purchase on tariff final decisions
- Tariffs remain a concern and are continually monitored
- This sector expanded at a slower rate than June, driven by the employment index expanding at a much slower rate than June. The lead time index slipped from expansion to slight contraction.
Health Care:
- In Healthcare we continue to work closely with our distributors and manufacturers to continue to hold price steady without making adjustments due to tariff charges. Margins for Healthcare institutions and facilities continue to be thin and any unprecedented increase in prices paid could potentially impact patient care. We remain vigilant and close to our strategic partners
- This sector continues to indicate strong expansion with only the lead time index indicating contraction. While expansion was still very strong, sales and production expanded slower than June.
Professional and Business Services:
- In the professional services and staffing business, there is not a shortage of expertise in the market. Certainly, there are specific unique job requirements (technical and specialize) where there may be pockets of what is “shortage,” but overall no shortages of supply. qualified people available to fill any open positions, whether direct or project hire
- Prices paid for professional services and general staffing remain very flat
- Even though the availability of qualified people exceeds the opportunities available, we are not seeing any significant reducing in what companies are willing to pay if and when they are hiring
- The supply chain is concerned about the uncertainty of US trade policies
- This sector’s performance indicated slight expansion in July, with strong expansion in sales. The production index still contracted but was just under neutral. The employment index and purchased inventory index also flipped from contraction to slight expansion.
Trend of Underlying Indicators
The Houston PMI is based on diffusion indices for eight underlying indicators. The net value of each indicator is simply the percentage of respondents who cite a positive shift from the previous month minus the percentage who cite a negative shift. The diffusion index is calculated based on the percent of respondents reporting higher results plus one-half of those responding the same with seasonal adjustments to the Sales/New Orders, Production, Employment, and Prices Paid indices based on an X13 ARIMA forecast. Values above 50 for Sales/New Orders, Production, Employment, Prices Paid, and Lead Times generally point towards expansion and values below 50 signal contraction. Note that the Prices Paid Index may not follow this trend late in an economic expansion. The Inventory measures have an inverse correlation at most forecast horizons, meaning that values below 50 point to expansion and values above point to contraction. The Purchases index is inversely correlated with economic activity at the three-month forecast horizon.
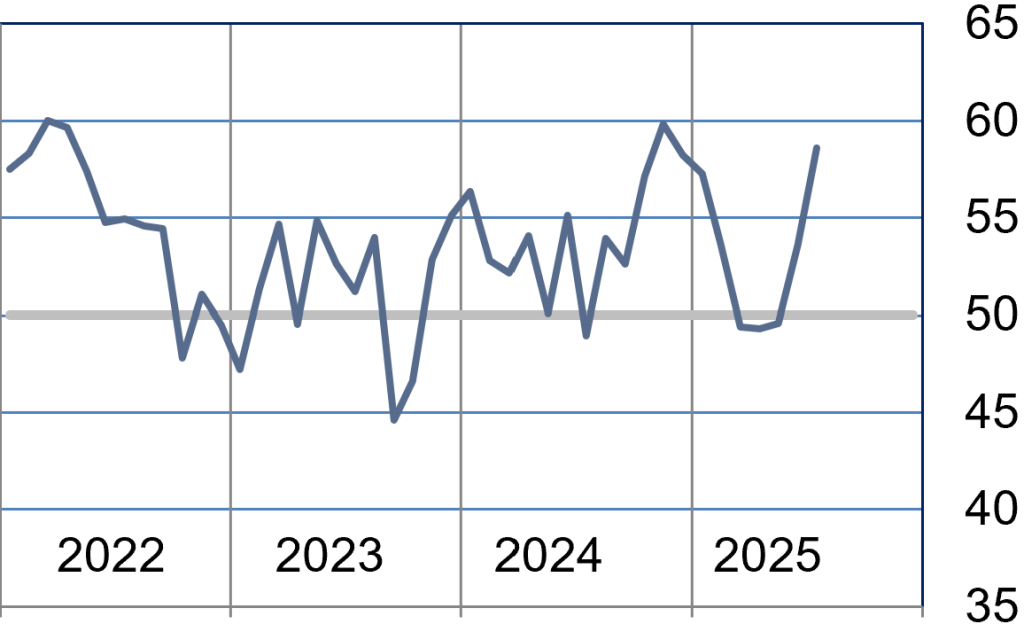
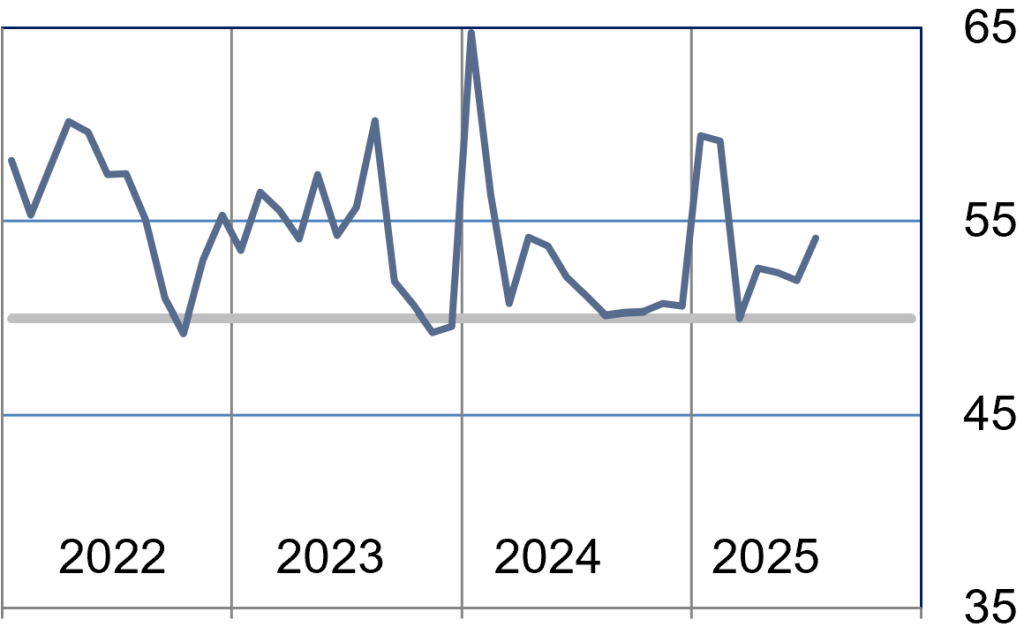
Sales/New Orders (Seasonally Adjusted)
The sales index expanded in July driven by strong expansion in the nonmanufacturing sector and the manufacturing sector flipping from contraction to expansion. Sales have had a four-month positive trend.
| Higher | Same | Lower | Net | Index | |
| Feb/25 | 16% | 81% | 3% | 13% | 53.6 |
| Mar/25 | 14% | 74% | 12% | 2% | 49.4 |
| Apr/25 | 16% | 71% | 13% | 3% | 49.3 |
| May/25 | 15% | 75% | 10% | 5% | 49.6 |
| Jun/25 | 20% | 67% | 13% | 7% | 53.6 |
| Jul/25 | 20% | 75% | 5% | 15% | 58.6 |
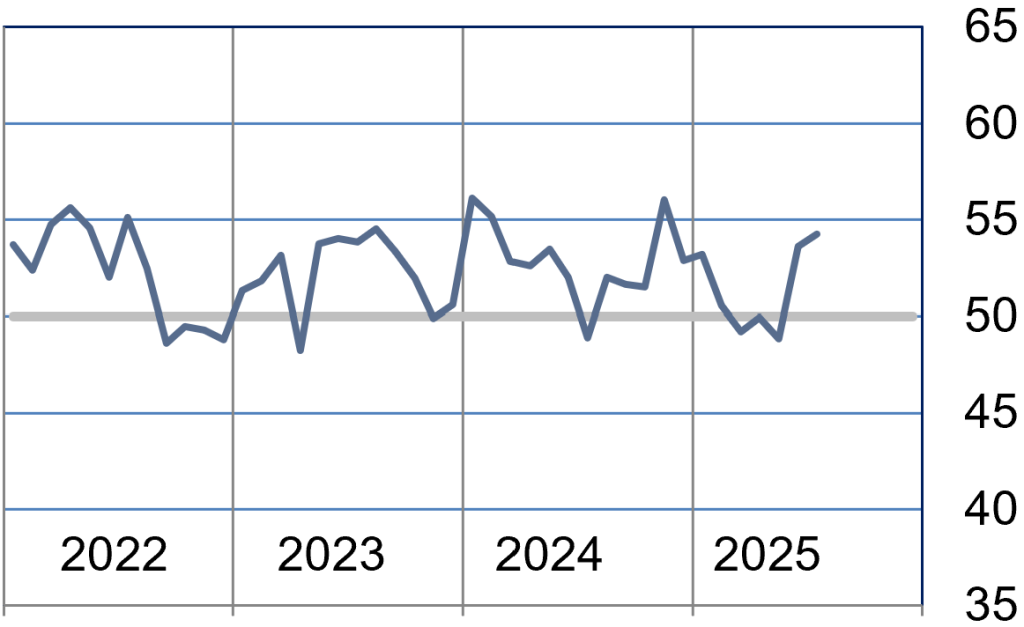
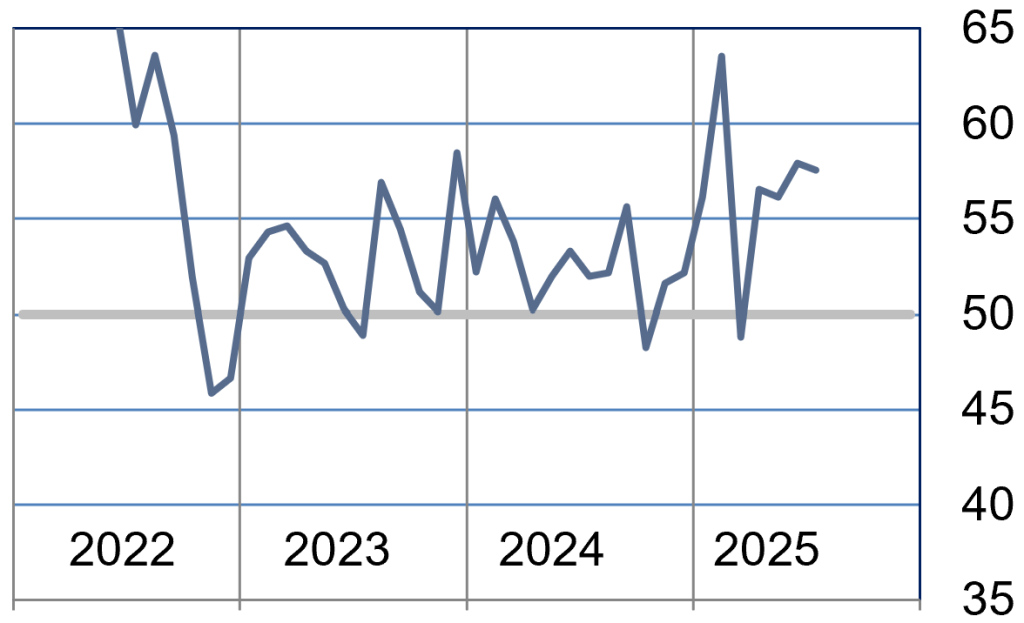
Production Index (Seasonally Adjusted)
The production index continued to expand at a faster rate in July. The manufacturing sector flipped from contraction to expansion. The non-manufacturing sector continued to expand but slightly slower than June.
| Higher | Same | Lower | Net | Index | |
| Feb/25 | 6% | 91% | 3% | 3% | 50.6 |
| Mar/25 | 8% | 85% | 7% | 1% | 49.2 |
| Apr/25 | 8% | 85% | 7% | 1% | 50.0 |
| May/25 | 6% | 88% | 6% | 0% | 48.9 |
| Jun/25 | 14% | 78% | 8% | 6% | 53.6 |
| Jul/25 | 12% | 86% | 2% | 10% | 54.2 |
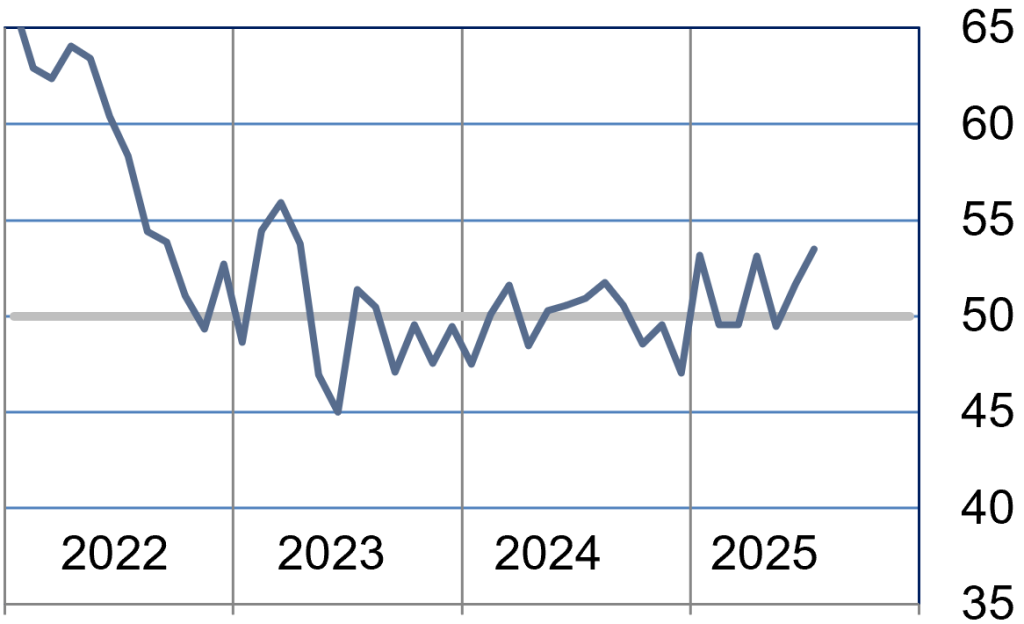
Employment Index (Seasonally Adjusted)
The employment index contracted for the fourth straight month, with both manufacturing and non-manufacturing contracting. The manufacturing sector saw slower contraction.
| Higher | Same | Lower | Net | Index | |
| Feb/25 | 2% | 93% | 5% | -3% | 47.5 |
| Mar/25 | 9% | 83% | 8% | 1% | 50.4 |
| Apr/25 | 5% | 84% | 11% | -6% | 45.5 |
| May/25 | 9% | 75% | 16% | -7% | 45.6 |
| Jun/25 | 8% | 83% | 9% | -1% | 48.6 |
| Jul/25 | 6% | 84% | 10% | -4% | 48.3% |
Purchases Index (Not Seasonally Adjusted)
The purchase index saw moderate expansion in July. The shift was manufacturing shifting from contraction to moderate expansion. The non-manufacturing sector expanded at a slower rate.
| Higher | Same | Lower | Net | Index | |
| Feb/25 | 23% | 75% | 2% | 21% | 59.2 |
| Mar/25 | 11% | 80% | 9% | 2% | 50.0 |
| Apr/25 | 19% | 73% | 8% | 11% | 52.6 |
| May/25 | 16% | 76% | 8% | 8% | 52.3 |
| Jun/25 | 14% | 75% | 11% | 3% | 51.9 |
| Jul/25 | 13% | 82% | 5% | 8% | 54.1% |
Prices Paid Index (Seasonally Adjusted)
The prices paid index continues to indicate strong expansion, but slightly slower than June. The manufacturing index was unchanged but non-manufacturing expanded slightly slower.
| Higher | Same | Lower | Net | Index | |
| Feb/25 | 33% | 65% | 2% | 31% | 63.5 |
| Mar/25 | 13% | 76% | 11% | 2% | 48.8 |
| Apr/25 | 18% | 79% | 3% | 15% | 56.5 |
| May/25 | 17% | 80% | 3% | 14% | 56.1 |
| Jun/25 | 18% | 78% | 4% | 14% | 57.9 |
| Jul/25 | 17% | 80% | 3% | 14% | 57.6 |
Lead Times Index (Not Seasonally Adjusted)
The lead time index indicated moderate expansion in July, with the manufacturing index indicating strong expansion. The non-manufacturing sector was relatively unchanged.
| Higher | Same | Lower | Net | Index | |
| Feb/25 | 3% | 95% | 2% | 1% | 49.5 |
| Mar/25 | 8% | 89% | 3% | 5% | 49.6 |
| Apr/25 | 11% | 87% | 2% | 9% | 53.1 |
| May/25 | 4% | 93% | 3% | 1% | 49.5 |
| Jun/25 | 6% | 91% | 3% | 3% | 51.7 |
| Jul/25 | 10% | 88% | 2% | 8% | 53.5% |
Purchased Inventory Index (Not Seasonally Adjusted)
The purchased inventory index saw slight expansion in July. The manufacturing index still contracted but much slower than June. The non-manufacturing index expanded faster than June.
| Higher | Same | Lower | Net | Index | |
| Feb/25 | 6% | 87% | 7% | -1% | 51.2 |
| Mar/25 | 6% | 87% | 7% | -1% | 47.8 |
| Apr/25 | 2% | 93% | 5% | -3% | 48.7 |
| May/25 | 2% | 94% | 4% | -2% | 47.7 |
| Jun/25 | 6% | 89% | 5% | 1% | 50.0 |
| Jul/25 | 6% | 91% | 3% | 3% | 52.4% |
Finished Goods Inventory Index (Not Seasonally Adjusted)
The finished goods inventory index was unchanged month over month. The manufacturing index flipped from contraction to expansion but the non-manufacturing sector expanded slower.
| Higher | Same | Lower | Net | Index | |
| Feb/25 | 6% | 88% | 6% | 0% | 49.9 |
| Mar/25 | 7% | 91% | 2% | 5% | 52.5 |
| Apr/25 | 5% | 91% | 4% | 1% | 50.7 |
| May/25 | 2% | 92% | 6% | -4% | 48.0 |
| Jun/25 | 9% | 88% | 3% | 6% | 53.1 |
| Jul/25 | 8% | 90% | 2% | 6% | 53.1 |
Projections for Key Long-Term Indicators
In addition to the current status of business activities, respondents to the ISM-Houston Business Survey also provide feedback on their view of the direction of the sales/new orders and employment indices six months into the future.
Six-Month Projection of the Sales/New Orders Index
The future sales index indicated expansion for the month of July. The manufacturing sector is indicating weakness but the non-manufacturing sector indicating strong expansion.
| Higher | Same | Lower | Net | Index | |
| Feb/25 | 23% | 75% | 2% | 21% | 47.8 |
| Mar/25 | 11% | 80% | 9% | 2% | 47.2 |
| Apr/25 | 19% | 73% | 8% | 11% | 48.9 |
| May/25 | 16% | 76% | 8% | 8% | 43.4 |
| Jun/25 | 14% | 75% | 11% | 3% | 41.9 |
| Jul/25 | 13% | 82% | 5% | 8% | 51.2 |
Six Month Projection of Employment Index
The future employment index continued to expand in July. The manufacturing contracted at a slower rate and the non-manufacturing sector expanded at a slower rate.
| Higher | Same | Lower | Net | Index | |
| Feb/25 | 17% | 73% | 10% | 7% | 50.4 |
| Mar/25 | 19% | 71% | 10% | 9% | 50.2 |
| Apr/25 | 13% | 72% | 15% | -2% | 48.5 |
| May/25 | 12% | 75% | 13% | -1% | 49.1 |
| Jun/25 | 13% | 77% | 10% | 3% | 51.7 |
| Jul/25 | 10% | 83% | 7% | 3% | 52.5 |
Background on the ISM-Houston Business Report and HPMI Calculation Methods
The Houston Purchasing Managers Index has been included as an integral part of the ISM-Houston Business Report since the Houston chapter of the Institute for Supply Management started publication of this document in January 1995. The report and index are published monthly as the primary deliverables from a survey of Houston area Supply Chain leaders regarding the status of key activities believed to provide insight into the strength of the economy. The respondents come from diverse organizations including construction, energy, engineering, health care, durable and non-durable goods manufacturing, financial and business services, wholesale and retail trade, and utilities related companies.
The Houston Purchasing Managers Index is determined from diffusion indices of the eight indicators of economic activity covered by the ISM-Houston Business Survey and Report. These underlying indicators are sales or new orders, production, employment, purchases, prices paid for major purchases, lead times from sellers, purchased materials inventory (raw materials and supplies), and finished goods inventories. The respondents to the survey report the direction of each these activities as either up, the same or down in comparison to the previous month. An index for each of these areas is then calculated by subtracting the percentage of respondents that sight a negative shift from the percentage that sight a positive shift. For indicators that are positively correlated with economic growth, this results in an underlying index that points to expansion when it is above zero. Indicators that are negatively correlated with growth point to expansion when they are below zero.
The final Houston PMI is calculated by applying optimal regression factors to each of the eight underlying indicators noted above. These regression factors are determined using standard regression techniques comparing these underlying indicators to the Houston-The Woodlands-Sugar Land Business Cycle Index (Houston BCI), which is reported on a monthly basis by the Federal Reserve Bank of Dallas. This top-level index is converted to a 0 to 100 scale to match that of the national Purchasing Managers Index® (PMI®) which is published monthly by the Institute for Supply Management® (ISM®). Readings over 50 for the HPMI generally indicate manufacturing expansion in the Houston in the near term and readings below 50 show coming manufacturing contraction.
It is important to note that the manufacturing breakeven HPMI does not equate to the breakeven point for the overall Houston economy. ISM-Houston periodically reviews the capability of its correlations and adjusts the regression factors when appropriate. The most recent revision occurred as a result of a review undertaken during the third quarter of 2018, which determined that changes in the Houston economy over the last decade have shifted the intercept of the correlation, causing a neutral Houston PMI to no longer align with a neutral Houston BCI. A Houston PMI of 45 points now equates to a neutral Houston economy as measured by the Houston BCI. A similar offset between the National PMI and the National economy has existed for some time.
Use of ISM-Houston Business Report Content
All information contained in this report is protected by copyright laws and ISM-Houston retains all rights to this Content. ISM-Houston hereby grants you a limited, revocable license to access, print, and display this Content solely for your personal, non-commercial use. Requests for permission to reproduce or redistribute ISM-Houston Business Report Content can be made by contacting the ISM-Houston Business Survey Committee at hpmi@ism-houston.org.
ISM-Houston shall not have any liability, duty, or obligation for or relating to the ISM-Houston Business Report Content or other information contained herein, any errors, inaccuracies, omissions or delays in providing any ISM-Houston Business Report Content, or for any actions taken in reliance thereon. In no event shall ISM-Houston be liable for any special, incidental, or consequential damages, arising out of the use of the ISM-Houston Business Report.