
For release August 12, 2024
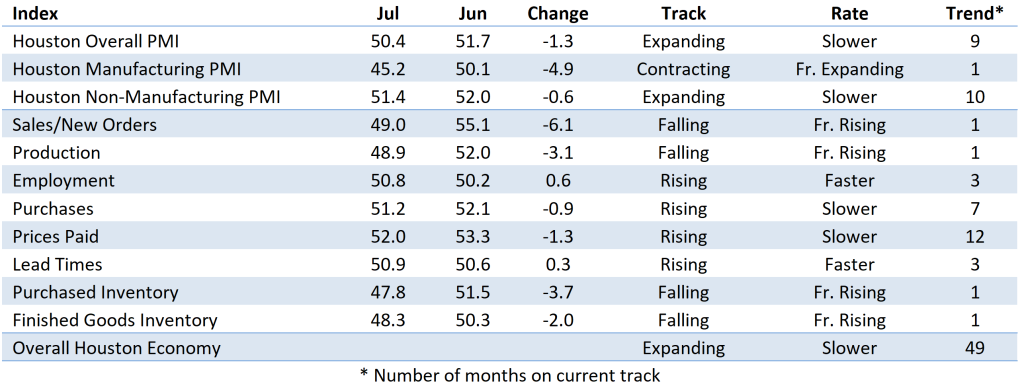
Houston PMI at 50.4 (down 1.3 points)
Sales/New Orders Contracting
Production Contracting
Employment Expanding
Prices Paid Expanding
Lead Times Expanding
Finished Goods Inventories Contracting
(Houston, Texas) – According to Houston area supply chain executives, economic activity in Houston showed mixed results in July, with the manufacturing sector indicating contraction while the non-manufacturing sector expanded.
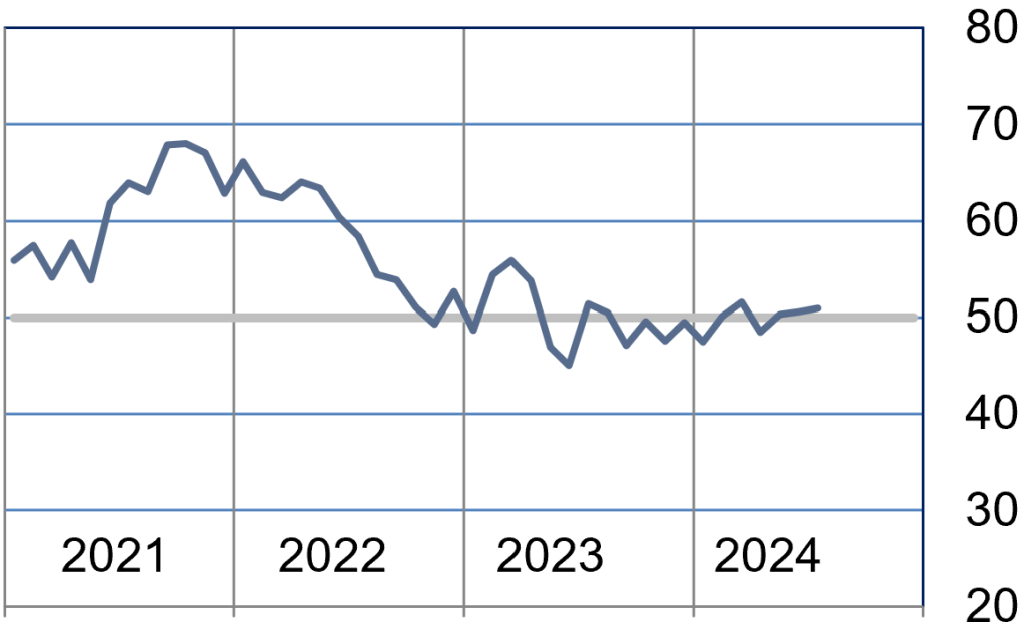
The Houston Purchasing Managers Index decreased 1.3 points to 50.4. Sales/new orders, employment and lead time are the top three indicators with a strong positive correlation with the Houston economy. This month, sales/new orders fell from expansion to slight contraction. Employment and lead time continued expanding. Sales/new orders fell 6.1 points, indicating slight contraction at 49.0 points . Employment was slightly stronger month over month, expanding 0.6 points to 50.8. The third indicator (lead times) remained relatively flat month over month, increasing 0.3 points to 50.9 points. The finished goods inventory index, the underlying indicator that has the strongest inverse correlation with economic activity, decreased 2.0 points to 48.3.
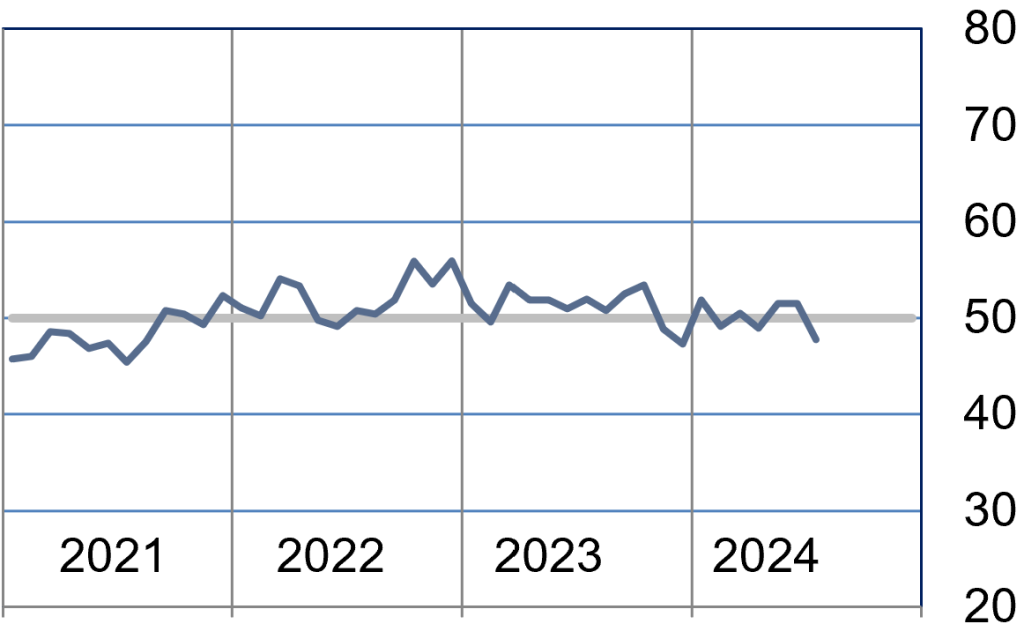
The Houston Manufacturing PMI decreased 4.9 points to 45.2, indicating a notable contraction in July. The nonmanufacturing PMI decreased 0.6 points to 51.4 points.
On an industry specific basis: construction, and professional and business services reported strong expansion. Oil and gas extraction and durable goods manufacturing reported significant contraction.
Click here to see the PDF version of the full report.
Indices at a Glance
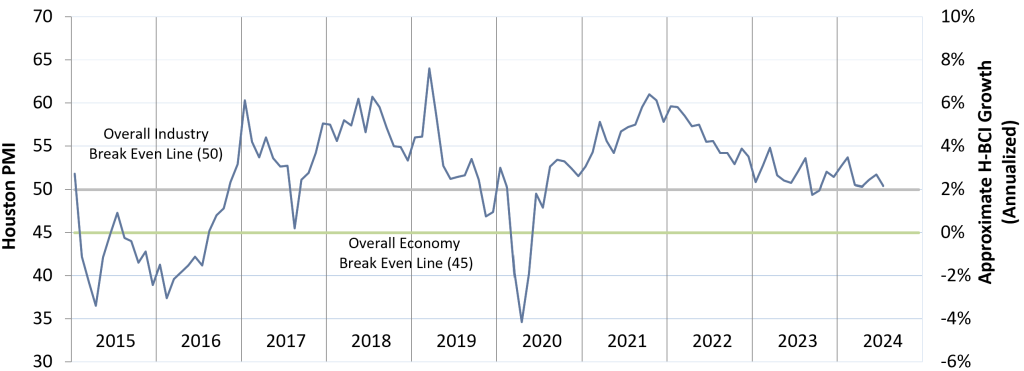
Houston PMI Trend
Houston PMI readings over 50 generally indicate that respondents see their activities as expanding. An HPMI above 45 normally correlates with expansion of the Houston-The Woodlands-Sugar Land Business Cycle Index (H-BCI).
Commodities Reported to have Notable Price Changes or to be in Short Supply
Up in Price: Oil field chemicals, propane, natural gas‡, natural gas liquids, normal butane, isobutane, propylene, polypropylene copolymer, ethylene, catalyst, elastomers, Teflon knitting wire, electrical gear and components, ocean container freight, rental construction equipment
Down in Price: Oil country tubular goods (OCTG), stainless steel, carbon steel, steel products, lumber, natural gas‡, ethane, nickel
In Short Supply: Skilled labor, low temperature piping materials, nonstandard metal alloys, Teflon and poly wire, PFA components, rotating equipment, electronics, electrical gear, electrical components, automation equipment, generators, offshore installation vessels
‡ reported as up or down by different respondents
What our Respondents are Saying
Oil and Gas Exploration, and Key Support Services:
- Flat to slightly down pricing outlook for 2H24
- Energy and fuel prices remained flat during the month, but have fallen since the Federal Reserve Bank’s recent announcement to hold interest rates firm for another month
- This sector indicated significant contraction for the month of July. The sales, lead time and employment indexes all indicated significant contraction. Production continues to indicate strong expansion.
Construction:
- General instability in the supply chain remains a challenge.
- Nonresidential, life sciences, tech supporting higher activity
- This sector continues to show strong growth; the employment, prices and purchase indexes continues to show strength; sales also saw strong month over expansion.
Durable Goods Manufacturing:
- PVC, PE, and PP resin prices remain stable.
- Incoming sales orders showed improvement over the month of June but are still down overall during this fiscal year compared to our last fiscal year.
- This sector fell back into contraction for the month of July; seven of the eight indexes pointed to significant contraction, with lead time being the only index indicating minimal expansion
Non-durable Goods Manufacturing:
- Cracking feedstock pricing (ethane, propane, normal butane, natural gasoline) are falling in early August in line with energy prices
- We continue to see upward pressure on ethylene and propylene pricing
- Precious metals prices remained flat during the month, but we are seeing downward pressure in early August
- Refinery rates have fallen in early August
- This sector’s performance is slightly contracting; sales/new orders indicated slight contraction, with lead time and prices indicating strong expansion. The employment index indicated significant contraction
Trade, Transportation, and Warehousing:
- Both national and Houston air passenger traffic are at record levels on a YTD basis
- This sector’s performance indicated slight contraction for the month of July; with all eight indexes hovering just below the neutral range.
Professional and Business Services:
- Unemployment rates are rising at a slow pace, but may be accelerating
- This sector’s performance indicated strong expansion for the month of July; the sales/new orders and production indexes indicated slight contraction. All other indexes point to expansion.
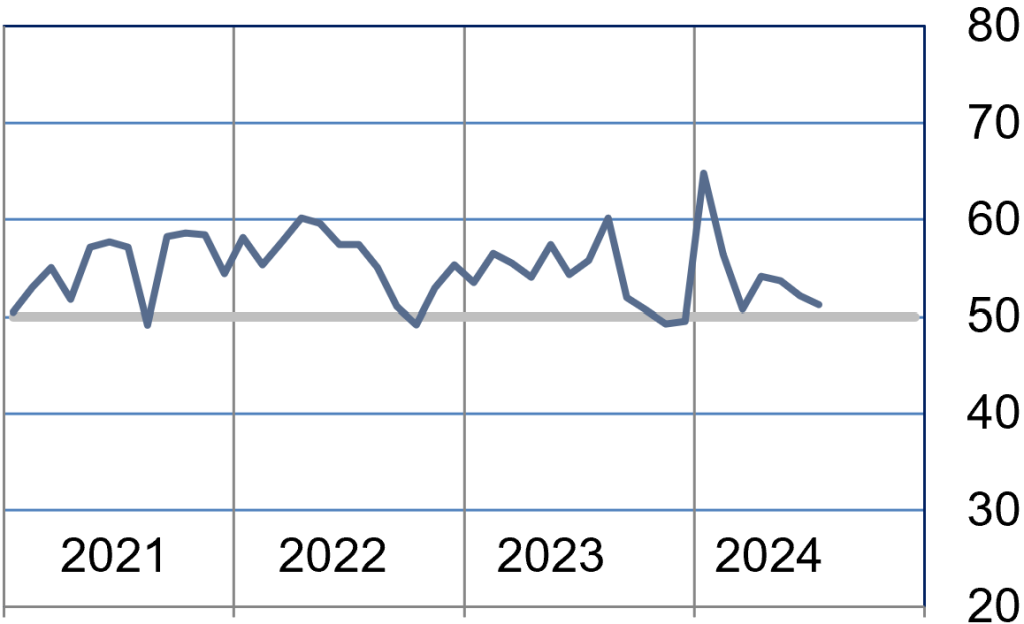
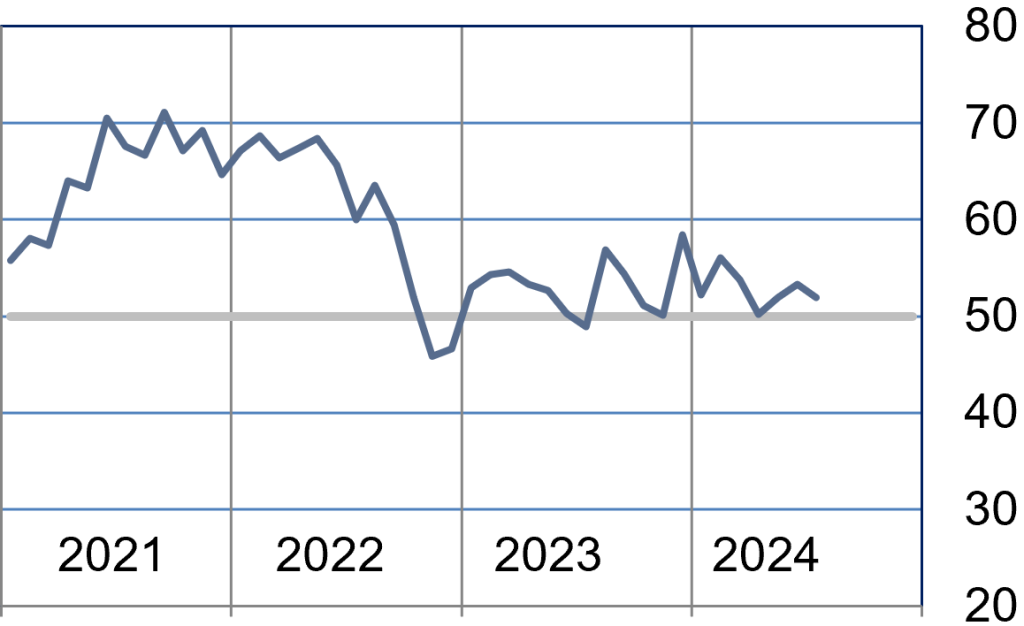
Trend of Underlying Indicators
The Houston PMI is based on diffusion indices for eight underlying indicators. The net value of each indicator is simply the percentage of respondents who cite a positive shift from the previous month minus the percentage who cite a negative shift. The diffusion index is calculated based on the percent of respondents reporting higher results plus one-half of those responding the same with seasonal adjustments to the Sales/New Orders, Production, Employment, and Prices Paid indices based on an X13 ARIMA forecast. Values above 50 for Sales/New Orders, Production, Employment, Prices Paid, and Lead Times generally point towards expansion and values below 50 signal contraction. Note that the Prices Paid Index may not follow this trend late in an economic expansion. The Inventory measures have an inverse correlation at most forecast horizons, meaning that values below 50 point to expansion and values above point to contraction. The Purchases index is inversely correlated with economic activity at the three-month forecast horizon.
Sales/New Orders (Seasonally Adjusted)
The sales/new orders index slipped just into contraction. The drop was caused by both the non-manufacturing and manufacturing sectors decreasing versus June, with manufacturing slipping into contraction.
| Higher | Same | Lower | Net | Index | |
| Feb/24 | 14% | 80% | 6% | 8% | 52.8 |
| Mar/24 | 14% | 77% | 9% | 5% | 52.2 |
| Apr/24 | 22% | 71% | 7% | 15% | 54.1 |
| May/24 | 9% | 85% | 6% | 3% | 50.1 |
| Jun/24 | 10% | 87% | 3% | 7% | 55.1 |
| Jul/24 | 5% | 89% | 6% | -1% | 49.0 |

Production Index (Seasonally Adjusted)
The production slipped into contraction for the first time in the last six months. It was driven by a steep decline in the manufacturing sector which moved from virtually neutral to significant contraction.
| Higher | Same | Lower | Net | Index | |
| Feb/24 | 12% | 85% | 3% | 9% | 55.2 |
| Mar/24 | 9% | 86% | 5% | 4% | 52.8 |
| Apr/24 | 14% | 83% | 3% | 11% | 52.6 |
| May/24 | 7% | 90% | 3% | 4% | 53.5 |
| Jun/24 | 10% | 85% | 5% | 5% | 52.0 |
| Jul/24 | 5% | 89% | 6% | -1% | 48.9 |

Employment Index (Seasonally Adjusted)
The employment index remained just above neutral. It was helped by the nonmanufacturing sector which continues to expand at a faster rate. The manufacturing sector contracted faster than June.
| Higher | Same | Lower | Net | Index | |
| Feb/24 | 15% | 79% | 6% | 9% | 56.8 |
| Mar/24 | 8% | 80% | 12% | -4% | 49.7% |
| Apr/24 | 6% | 87% | 7% | -1% | 48.1 |
| May/24 | 13% | 79% | 8% | 5% | 52.4 |
| Jun/24 | 9% | 86% | 5% | 4% | 50.2 |
| Jul/24 | 9% | 83% | 8% | 1% | 50.8 |

Purchases Index (Not Seasonally Adjusted)
The purchases index expanded at a slower rate in June; driven by the non-manufacturing sector expanding at a slower rate than June. The manufacturing sector switched from contraction to slight expansion.
| Higher | Same | Lower | Net | Index | |
| Feb/24 | 17% | 79% | 4% | 13% | 56.4 |
| Mar/24 | 11% | 80% | 9% | 2% | 50.8 |
| Apr/24 | 14% | 80% | 6% | 8% | 54.2 |
| May/24 | 13% | 82% | 5% | 8% | 53.7 |
| Jun/24 | 10% | 85% | 5% | 5% | 52.1 |
| Jul/24 | 11% | 81% | 8% | 3% | 51.2 |
Prices Paid Index (Seasonally Adjusted)
The prices paid index expanded at a slower rate in July as both manufacturing and nonmanufacturing saw slower expansion in this index.
| Higher | Same | Lower | Net | Index | |
| Feb/24 | 12% | 83% | 5% | 7% | 56.1 |
| Mar/24 | 12% | 84% | 4% | 8% | 53.8 |
| Apr/24 | 6% | 90% | 4% | 2% | 50.2 |
| May/24 | 6% | 90% | 4% | 2% | 52.0 |
| Jun/24 | 5% | 91% | 4% | 1% | 53.3 |
| Jul/24 | 10% | 86% | 4% | 6% | 52.0 |
Lead Times Index (Not Seasonally Adjusted)
The lead times index continues to hover just above neutral. As in June, the manufacturing sector indicates significant expansion while the nonmanufacturing sector indicates slight contraction.
| Higher | Same | Lower | Net | Index | |
| Feb/24 | 4% | 92% | 4% | 0% | 50.1 |
| Mar/24 | 6% | 91% | 3% | 3% | 51.6 |
| Apr/24 | 5% | 87% | 8% | -3% | 48.4 |
| May/24 | 5% | 90% | 5% | 0% | 50.3 |
| Jun/24 | 5% | 91% | 4% | 1% | 50.6 |
| Jul/24 | 4% | 94% | 2% | 2% | 50.9 |
Purchased Inventory Index (Not Seasonally Adjusted)
The purchased inventory index saw moderate contraction in July; driven by a sharp decline in the manufacturing sector’s result. The manufacturing sector switched from moderate expansion to significant contraction
| Higher | Same | Lower | Net | Index | |
| Feb/24 | 3% | 92% | 5% | -2% | 49.1 |
| Mar/24 | 8% | 85% | 7% | 1% | 50.5 |
| Apr/24 | 4% | 90% | 6% | -2% | 48.9 |
| May/24 | 6% | 91% | 3% | 3% | 51.5 |
| Jun/24 | 5% | 93% | 2% | 3% | 51.5 |
| Jul/24 | 2% | 91% | 7% | -5% | 47.8 |
Finished Goods Inventory Index (Not Seasonally Adjusted)
The finished goods inventory index switched back to contraction from expansion for the month of July. While nonmanufacturing was virtually unchanged, manufacturing swung from moderate expansion to contraction.
| Higher | Same | Lower | Net | Index | |
| Feb/24 | 5% | 90% | 5% | 0% | 49.6 |
| Mar/24 | 11% | 86% | 3% | 8% | 53.9 |
| Apr/24 | 6% | 85% | 9% | -3% | 48.8 |
| May/24 | 3% | 93% | 4% | -1% | 49.4 |
| Jun/24 | 4% | 92% | 4% | 0% | 50.3 |
| Jul/24 | 2% | 93% | 5% | -3% | 48.3 |

Background on the ISM-Houston Business Report and HPMI Calculation Methods
The Houston Purchasing Managers Index has been included as an integral part of the ISM-Houston Business Report since the Houston chapter of the Institute for Supply Management started publication of this document in January 1995. The report and index are published monthly as the primary deliverables from a survey of Houston area Supply Chain leaders regarding the status of key activities believed to provide insight into the strength of the economy. The respondents come from diverse organizations including construction, energy, engineering, health care, durable and non-durable goods manufacturing, financial and business services, wholesale and retail trade, and utilities related companies.
The Houston Purchasing Managers Index is determined from diffusion indices of the eight indicators of economic activity covered by the ISM-Houston Business Survey and Report. These underlying indicators are sales or new orders, production, employment, purchases, prices paid for major purchases, lead times from sellers, purchased materials inventory (raw materials and supplies), and finished goods inventories. The respondents to the survey report the direction of each these activities as either up, the same or down in comparison to the previous month. An index for each of these areas is then calculated by subtracting the percentage of respondents that sight a negative shift from the percentage that sight a positive shift. For indicators that are positively correlated with economic growth, this results in an underlying index that points to expansion when it is above zero. Indicators that are negatively correlated with growth point to expansion when they are below zero.
The final Houston PMI is calculated by applying optimal regression factors to each of the eight underlying indicators noted above. These regression factors are determined using standard regression techniques comparing these underlying indicators to the Houston-The Woodlands-Sugar Land Business Cycle Index (Houston BCI), which is reported on a monthly basis by the Federal Reserve Bank of Dallas. This top-level index is converted to a 0 to 100 scale to match that of the national Purchasing Managers Index® (PMI®) which is published monthly by the Institute for Supply Management® (ISM®). Readings over 50 for the HPMI generally indicate manufacturing expansion in the Houston in the near term and readings below 50 show coming manufacturing contraction.
It is important to note that the manufacturing breakeven HPMI does not equate to the breakeven point for the overall Houston economy. ISM-Houston periodically reviews the capability of its correlations and adjusts the regression factors when appropriate. The most recent revision occurred as a result of a review undertaken during the third quarter of 2018, which determined that changes in the Houston economy over the last decade have shifted the intercept of the correlation, causing a neutral Houston PMI to no longer align with a neutral Houston BCI. A Houston PMI of 45 points now equates to a neutral Houston economy as measured by the Houston BCI. A similar offset between the National PMI and the National economy has existed for some time.
Use of ISM-Houston Business Report Content
All information contained in this report is protected by copyright laws and ISM-Houston retains all rights to this Content. ISM-Houston hereby grants you a limited, revocable license to access, print, and display this Content solely for your personal, non-commercial use. Requests for permission to reproduce or redistribute ISM-Houston Business Report Content can be made by contacting the ISM-Houston Business Survey Committee at hpmi@ism-houston.org.
ISM-Houston shall not have any liability, duty, or obligation for or relating to the ISM-Houston Business Report Content or other information contained herein, any errors, inaccuracies, omissions or delays in providing any ISM-Houston Business Report Content, or for any actions taken in reliance thereon. In no event shall ISM-Houston be liable for any special, incidental, or consequential damages, arising out of the use of the ISM-Houston Business Report.