
For release August 10, 2022
July 2022 ISM-Houston Business Report
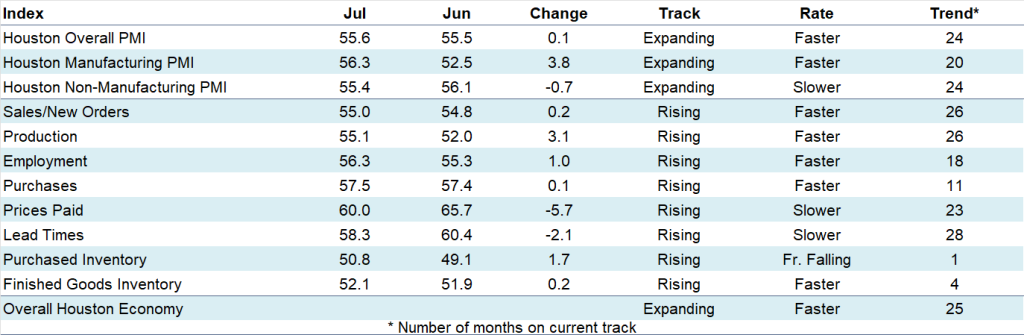
Houston PMI at 55.6 (up 0.1 points)
Sales/New Orders at 55.0 (up 0.2 points)
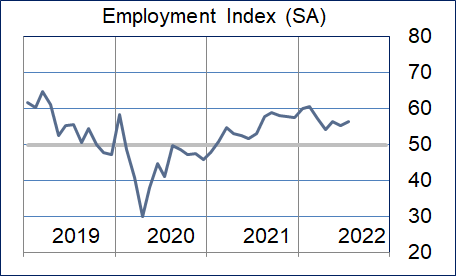
Employment at 56.3 (up 1.0 points)
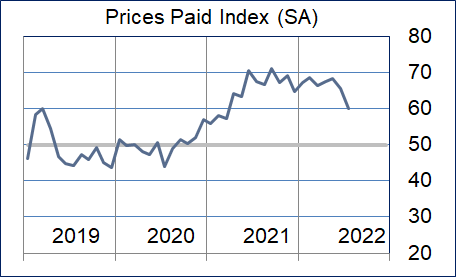
Prices Paid at 60.0 (down 5.7 points)
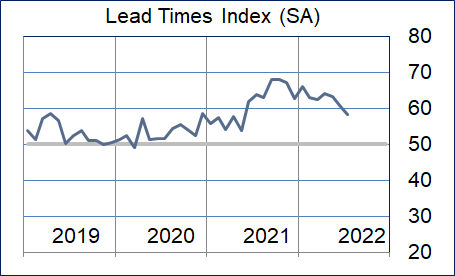
Lead Times at 58.3 (down 2.1 points)
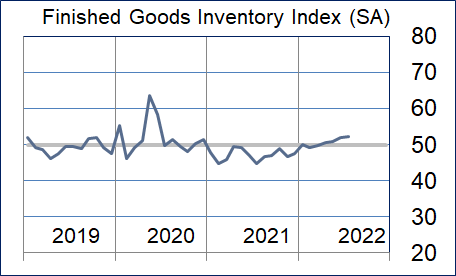
Finished Goods Inventories at 52.1 (up 0.2 points)
(Houston, Texas) – According to Houston area supply chain executives, economic activity in Houston expanded in July at a similar rate to June. Manufacturing activities expanded at stronger pace while non-manufacturing activities showed minimally slower expansion.
The Houston Purchasing Managers Index rose 0.1 points to 55.6. A lower lead times index was offset by moderately higher sales/new orders and employment indices, The finished goods inventory index rose minimally. The first three of these indicators have the strongest direct correlation with economic activity in Houston. The sales/new orders index rose 0.2 points to 55.0, the employment index rose 1.0 points to 56.3, and the lead times index fell 2.1 points to 58.3. The Finished goods inventory index, the underlying indicator that has the strongest inverse correlation with economic activity, rose 0.2 points to 52.1, continuing to give a modest indication of contraction.
As noted earlier this year, ISM-Houston is now reporting separate indices for manufacturing and non-manufacturing industries in addition to the overall Houston Purchasing Managers Index. The HPMI forecast has been eliminated from this report. The Houston Manufacturing PMI rose 3.8 points to 56.3, pointing to modestly faster expansion. The non-manufacturing PMI fell 0.7 points to 55.4 showing modestly lower expansion for the industries in this sector.
On an industry specific basis healthcare, oil & gas extraction, construction, leisure and hospitality, manufacturing, professional and management services, and transportation, trade, and warehousing reported strong expansion. Real estate reported very modest expansion.
Click here for the hard copy version of the report.
Indices at a Glance
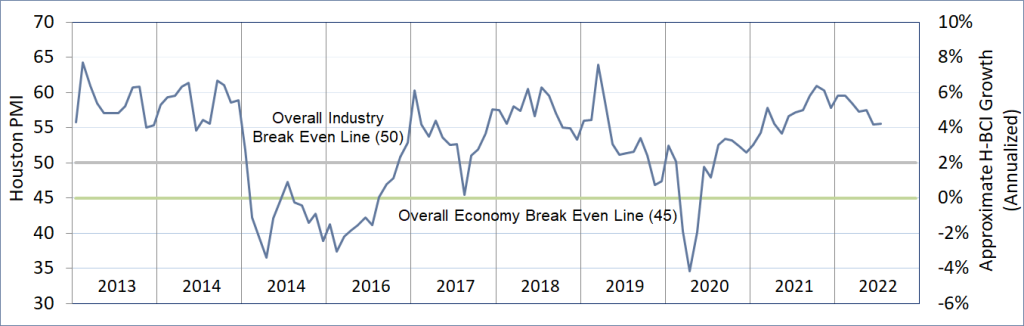
Houston PMI Trend
Houston PMI readings over 50 generally indicate that respondents see their activities as expanding. An HPMI above 45 normally correlates with expansion of the Houston-The Woodlands-Sugar Land Business Cycle Index (H-BCI).
Commodities Reported to have Notable Price Changes or to be in Short Supply
Up in Price: Engineering services, general labor; medical supplies not related to Covid; diesel‡, electric power, other utilities; rigs, steel pipe, steel forgings and castings, copper components; specialty chemicals, chlorine, caustic soda, ammonia, nitric acid; capital equipment, electrical gear and components, control systems hardware, cables, instrumentation, computer software and hardware
Down in Price: Crude oil, gasoline, diesel‡, jet fuel, natural gas; natural gas liquids, propane, butane, isobutane, pentane, naphtha; ethylene and propylene glycols, ethylene dichloride; polyethylene, polypropylene and PVC resins; precious metals for catalysts (gold, silver, platinum), industrial metals (aluminum, copper, nickel), steel raw materials (iron ore, nickel, cobalt), carbon and alloy steel products, copper wire and cable, motors; ocean freight
In Short Supply: Skilled and unskilled field labor, rig labor, frac crews; lab supplies (tubes, holders), IV fluids; seamless casing/tubing, rigs, vehicles; specialty chemicals, uncured rubber compounds, sodium silicate, caustic soda, ethylene dichloride; copper, steel products, roofing materials; semiconductor chips, computer hardware, control system hardware, electrical gear and components
‡ reported as up or down by different respondents
What our Respondents are Saying
Oil and Gas Exploration, and Key Support Services:
- Volatile business environment with sustained supply chain risks
- Surety of supply remains a challenge
- This sector continued its strong expansion with the production and employment indices moderating somewhat while the prices paid, and lead times indices rose
Construction:
- This sector showed continued expansion with the employment, prices paid, and lead times indices remaining well above neutral
Durable Goods Manufacturing:
- Our business has experienced continuous demand and increasing sales orders since the beginning of the year
- We continue to experience challenges with supply shortages and long lead times, but are able to mitigate these problems by expanding our supplier base
- This sector’s overall performance returned to showing expansion with the sales/new orders, production, purchases, prices paid, and lead times indices showing considerable strength
Non-durable Goods Manufacturing:
- Our sales are strong and forecast shows no change
- Suppliers indicating stable backlog for 2022, however uncertainties have been indicated for orders in 2023
- Inflation continues to show impacts to our business
- Demand is falling in finished goods that serve construction and manufacturing, but inflation continues to impact cost
- Carbon and alloy steel feed components (iron ore, nickel, cobalt, manganese, molybdenum) continued to fall in July
- Prices for industrial metals (aluminum, copper, nickel) fell again this month
- Cracker feedstocks (ethane, propane, butane, natural gas liquids) and most petrochemical product prices were down
- This sector reported modestly lower strength with the purchases, prices paid, and lead times indices pointing to expansion at a significantly slower pace while the production index rose significantly
Trade, Transportation, and Warehousing:
- Containerized ocean freight prices fell further this month
- This sector remained above neutral with the production, employment, and purchases indices rising sharply while the prices paid and lead times indices moderated
Real-Estate Services:
- As with last month, all indices and the overall performance for this sector came in near neutral; industrial and apartment related real-estate continues to expand, while housing and office real-estate are contracting at a slow pace
Professional and Business Services:
- Mega-projects for EV components and computer chips in the US are impacting the labor market
- Fairly balanced right now but there are pockets of expertise that remain in high demand and low supply
- The last two months have seen salaries and hourly contract rates leveling off without significant increases
- We see an oil price of $80-100/bbl on a long term basis creating improved confidence in budget decisions
- This sector moderated minimally during the month, but continues to show expansion; the employment, purchases, and prices paid indices expanded at a slower rate, while all other indices were reported near neutral
Leisure and Hospitality:
- This sector expanded at a similar rate to last month; the sales/new orders, employment, prices paid, and lead times indicators continue to point to significant strength
Health Care:
- The market is still constrained by supplier stocks, especially materials coming from overseas
- We anticipate additional price increases, especially in the 4th quarter
- The labor market is getting better as rates go up and companies put the brakes on hiring
- This sector reported expansion at a similar rapid pace to last month with all positively correlated indicators reporting robust expansion
Trend of Underlying Indicators
The Houston PMI is based on diffusion indices for eight underlying indicators. The net value of each indicator is simply the percentage of respondents who cite a positive shift from the previous month minus the percentage who cite a negative shift. The diffusion index is calculated based on the percent of respondents reporting higher results plus one-half of those responding the same with a seasonal adjustment based on an X13 ARIMA forecast. Values above 50 for Sales/New Orders, Production, Employment, Prices Paid, and Lead Times generally point towards expansion and values below 50 signal contraction. Note that the Prices Paid Index may not follow this trend late in an economic expansion. The Inventory measures have an inverse correlation at most forecast horizons, meaning that values below 50 point to expansion and values above point to contraction. The Purchases index is inversely correlated with economic activity at the three-month forecast horizon.
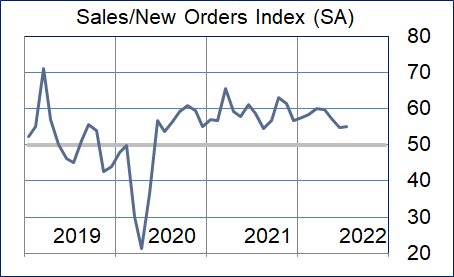
Sales/New Orders
The sales/new orders index rose marginally with manufacturing sales rebounding to indicate expansion. Non-manufacturing activities expanded at a modestly lower rate.
| Higher | Same | Lower | Net | Index | |
| Feb/22 | 21% | 78% | 1% | 20% | 58.3 |
| Mar/22 | 22% | 77% | 1% | 21% | 60.0 |
| Apr/22 | 24% | 75% | 1% | 23% | 59.7 |
| May/22 | 21% | 77% | 2% | 19% | 57.4 |
| Jun/22 | 14% | 82% | 4% | 10% | 54.8 |
| Jul/22 | 15% | 81% | 4% | 11% | 55.0 |
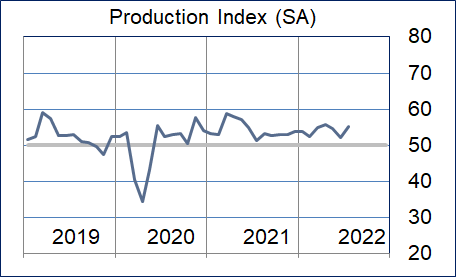
Production Index
The production index also rose, led by a significant improvement in manufacturing. As with the sales/new orders index, this index returned to indicating expansion for durable goods manufacturing.
| Higher | Same | Lower | Net | Index | |
| Feb/22 | 7% | 92% | 1% | 6% | 52.4 |
| Mar/22 | 11% | 88% | 1% | 10% | 54.8 |
| Apr/22 | 13% | 86% | 1% | 12% | 55.6 |
| May/22 | 12% | 87% | 1% | 11% | 54.6 |
| Jun/22 | 7% | 91% | 2% | 5% | 52.0 |
| Jul/22 | 13% | 84% | 3% | 10% | 55.1 |
Employment Index
The employment index rose modestly with improvements in both the manufacturing and nonmanufacturing sectors. Non-manufacturing activities showed the greatest strength.
| Feb/22 | 21% | 78% | 1% | 20% | 60.5 |
| Mar/22 | 15% | 84% | 1% | 14% | 57.3 |
| Apr/22 | 15% | 83% | 2% | 13% | 54.1 |
| May/22 | 17% | 81% | 2% | 15% | 56.4 |
| Jun/22 | 15% | 84% | 1% | 14% | 55.3 |
| Jul/22 | 15% | 83% | 2% | 13% | 56.3 |
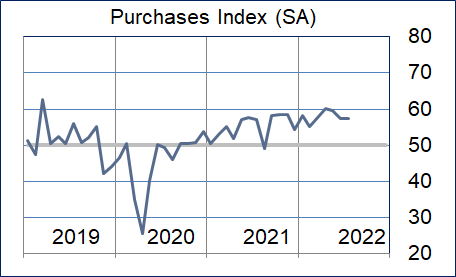
Purchases Index
The purchases index was relatively unchanged. Most sectors continue to indicate that this index is pointing to strong expansion.
| Feb/22 | 11% | 88% | 1% | 10% | 55.3 |
| Mar/22 | 19% | 80% | 1% | 18% | 57.7 |
| Apr/22 | 22% | 77% | 1% | 21% | 60.1 |
| May/22 | 21% | 77% | 2% | 19% | 59.6 |
| Jun/22 | 19% | 79% | 2% | 17% | 57.4 |
| Jul/22 | 17% | 79% | 4% | 13% | 57.5 |
Prices Paid Index
The prices paid index continues to point to expansion, but at a slower rate. A significant number of commodities continue to be reported as down in price and this index is at its lowest level since early last year.
| Higher | Same | Lower | Net | Index | |
| Feb/22 | 39% | 60% | 1% | 38% | 68.7 |
| Mar/22 | 38% | 61% | 1% | 37% | 66.4 |
| Apr/22 | 41% | 58% | 1% | 40% | 67.4 |
| May/22 | 41% | 58% | 1% | 40% | 68.4 |
| Jun/22 | 33% | 65% | 2% | 31% | 65.7 |
| Jul/22 | 24% | 69% | 7% | 17% | 60.0 |
Lead Times Index
The lead times index fell modestly. Nearly all sectors continue to report this index expanding at a strong pace.
| Feb/22 | 31% | 65% | 4% | 27% | 62.9 |
| Mar/22 | 31% | 64% | 5% | 26% | 62.4 |
| Apr/22 | 36% | 61% | 3% | 33% | 64.0 |
| May/22 | 33% | 63% | 4% | 29% | 63.4 |
| Jun/22 | 26% | 70% | 4% | 22% | 60.4 |
| Jul/22 | 22% | 73% | 5% | 17% | 58.3 |
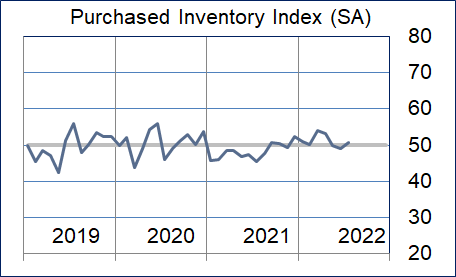
Purchased Inventory Index
The purchased inventory index rose to just above neutral. Health care, transportation and trade, and durable goods manufacturing reported these inventories as expanding at a rapid pace.
| Higher | Same | Lower | Net | Index | |
| Feb/22 | 7% | 90% | 3% | 4% | 50.2 |
| Mar/22 | 11% | 88% | 1% | 10% | 54.1 |
| Apr/22 | 10% | 88% | 2% | 8% | 53.3 |
| May/22 | 6% | 92% | 2% | 4% | 49.7 |
| Jun/22 | 7% | 86% | 7% | 0% | 49.1 |
| Jul/22 | 9% | 85% | 6% | 3% | 50.8 |
Finished Goods Inventory Index
The finished goods inventory index rose modestly. Durable goods manufacturing reported this index as expanding at a rapid pace again this month. All other sectors reported this index near neutral.
| Higher | Same | Lower | Net | Index | |
| Feb/22 | 6% | 89% | 5% | 1% | 49.3 |
| Mar/22 | 5% | 89% | 6% | -1% | 49.9 |
| Apr/22 | 6% | 91% | 3% | 3% | 50.5 |
| May/22 | 5% | 91% | 4% | 1% | 50.8 |
| Jun/22 | 5% | 92% | 3% | 2% | 51.9 |
| Jul/22 | 8% | 88% | 4% | 4% | 52.1 |
Background on the ISM-Houston Business Report and HPMI Calculation Methods
The Houston Purchasing Managers Index has been included as an integral part of the ISM-Houston Business Report since the Houston chapter of the Institute for Supply Management started publication of this document in January 1995. The report and index are published monthly as the primary deliverables from a survey of Houston area Supply Chain leaders regarding the status of key activities believed to provide insight into the strength of the economy. The respondents come from diverse organizations including construction, energy, engineering, health care, durable and non-durable goods manufacturing, financial and business services, wholesale and retail trade, and utilities related companies.
The Houston Purchasing Managers Index is determined from diffusion indices of the eight indicators of economic activity covered by the ISM-Houston Business Survey and Report. These underlying indicators are sales or new orders, production, employment, purchases, prices paid for major purchases, lead times from sellers, purchased materials inventory (raw materials and supplies), and finished goods inventories. The respondents to the survey report the direction of each these activities as either up, the same or down in comparison to the previous month. An index for each of these areas is then calculated by subtracting the percentage of respondents that sight a negative shift from the percentage that sight a positive shift. For indicators that are positively correlated with economic growth, this results in an underlying index that points to expansion when it is above zero. Indicators that are negatively correlated with growth point to expansion when they are below zero.
The final Houston PMI is calculated by applying optimal regression factors to each of the eight underlying indicators noted above. These regression factors are determined using standard regression techniques comparing these underlying indicators to the Houston-The Woodlands-Sugar Land Business Cycle Index (Houston BCI), which is reported on a monthly basis by the Federal Reserve Bank of Dallas. This top-level index is converted to a 0 to 100 scale to match that of the national Purchasing Managers Index® (PMI®) which is published monthly by the Institute for Supply Management® (ISM®). Readings over 50 for the HPMI generally indicate manufacturing expansion in the Houston in the near term and readings below 50 show coming manufacturing contraction.
It is important to note that the manufacturing breakeven HPMI does not equate to the breakeven point for the overall Houston economy. ISM-Houston periodically reviews the capability of its correlations and adjusts the regression factors when appropriate. The most recent revision occurred as a result of a review undertaken during the third quarter of 2018, which determined that changes in the Houston economy over the last decade have shifted the intercept of the correlation, causing a neutral Houston PMI to no longer align with a neutral Houston BCI. A Houston PMI of 45 points now equates to a neutral Houston economy as measured by the Houston BCI. A similar offset between the National PMI and the National economy has existed for some time.
Use of ISM-Houston Business Report Content
All information contained in this report is protected by copyright laws and ISM-Houston retains all rights to this Content. ISM-Houston hereby grants you a limited, revocable license to access, print, and display this Content solely for your personal, non-commercial use. Requests for permission to reproduce or redistribute ISM-Houston Business Report Content can be made by contacting the ISM-Houston Business Survey Committee at hpmi@ism-houston.org.
ISM-Houston shall not have any liability, duty, or obligation for or relating to the ISM-Houston Business Report Content or other information contained herein, any errors, inaccuracies, omissions or delays in providing any ISM-Houston Business Report Content, or for any actions taken in reliance thereon. In no event shall ISM-Houston be liable for any special, incidental, or consequential damages, arising out of the use of the ISM-Houston Business Report.