Houston PMI at 50.2 (unchanged from December)
Sales/New Orders Expanding
Production Expanding
Employment Contracting
Prices Paid Expanding
Lead Times Expanding
Finished Goods Inventories Expanding
(Houston, Texas) – According to Houston area supply chain executives, economic activity in Houston continued to expand in January. The manufacturing sector moved to expansion for the first time in six months, while non-manufacturing activity moved to modest contraction. The overall Houston economy expanded for the 68th month in a row.
The Houston Purchasing Managers Index was unchanged from December at 50.2 points, indicating very minimal expansion. Of the three underlying indicators that have a strong direct correlation with economic activity, sales/new orders and lead times are now pointing to modest strength. The third indicator with a strong direct correlation, employment, moved to pointing to stronger contraction. The sales/new orders index rose 2.7 points to 52.5 points, the lead times index rose 1.4 points to 54.5 points, and the employment index fell 2.5 points to 46.7 points. The finished goods inventory index, the underlying indicator that has the strongest inverse correlation with economic activity, was unchanged at 51.2 points, indicating expansion of this indicator for the eighth month in a row.
The Houston Manufacturing PMI rose a strong 6.1 points during the month to 53.0 points, indicating moderate to strong expansion in this sector for the first time in six months. The non-manufacturing PMI fell 1.1 points to 49.7 points, pointing to modest contraction for the first time in eight months
On an industry specific basis durable goods manufacturing joined professional services, health care, and construction reporting strong expansion. Non-durable goods manufacturing reported modest expansion. Trade, transportation, and warehousing reported weakness.
Please click here to go to the hardcopy version of the report.
Analysis and report by Ross Harvison (ISM-Houston Business Survey Committee Chair)
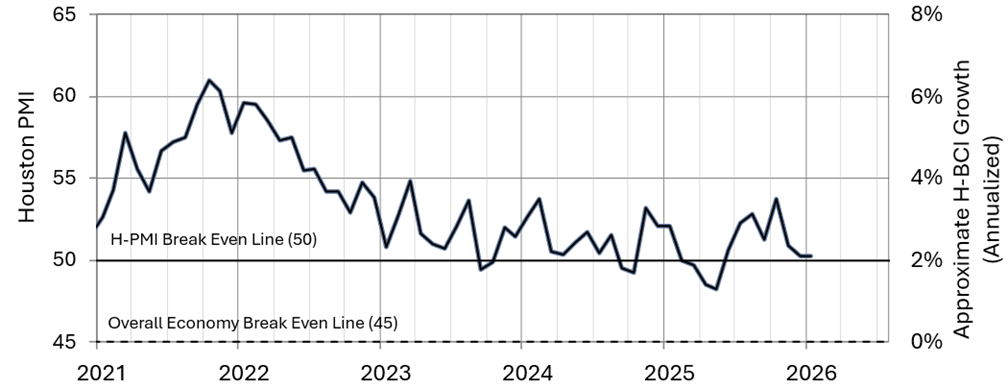
Houston PMI Trend
Indices at a Glance
Houston PMI readings over fifty indicate that respondents see their activities as expanding. An H-PMI above 45 normally correlates with expansion of the Houston-The Woodlands-Sugar Land Business Cycle Index.
| Index | Jan | Dec | Change | Track | Rate | Trend* |
| Houston Overall PMI | 50.2 | 50.2 | 0.0 | Expanding | Unchanged | 8 |
| Houston Manufacturing PMI | 53.0 | 46.8 | 6.2 | Expanding | Fr. Cont. | 1 |
| Houston Non-Manufacturing PMI | 49.7 | 50.8 | -1.1 | Contracting | Fr. Exp. | 1 |
| Sales/New Orders | 52.5 | 49.9 | 2.6 | Rising | Fr. Falling | 1 |
| Production | 52.4 | 51.7 | 0.7 | Rising | Faster | 8 |
| Employment | 46.7 | 49.3 | -2.6 | Falling | Faster | 2 |
| Purchases | 53.3 | 50.7 | 2.6 | Rising | Faster | 25 |
| Prices Paid | 60.3 | 50.7 | 9.6 | Rising | Faster | 4 |
| Lead Times | 54.5 | 53.2 | 1.3 | Rising | Faster | 2 |
| Purchased Inventory | 48.9 | 52.9 | -4.0 | Falling | Fr. Rising | 1 |
| Finished Goods Inventory | 51.2 | 51.2 | 0.0 | Rising | Unchanged | 8 |
| Houston Economy | Expanding | Unchanged | 68 | |||
| * Number of months on current track | ||||||
Commodities Reported to be Up/Down in Price or in Short Supply
Up in Price: Crude oil, natural gas, gasoline‡; imported finished products; oil field chemicals, cracking feedstocks; polymer film, ethylene oxide and derivatives; carbon steel, stainless steel, aluminum shapes, industrial metals (aluminum, nickel, cobalt), precious metals for catalysts (gold, silver, platinum, rhodium), electrical equipment and commodities, pumps, lumber; ocean container freight from Asia.
Down in Price: Some professional services; gasoline‡; polymer resins, catalysts; breakbulk freight.
In Short Supply: Skilled labor, electricians, welders; stainless steel, heat exchangers, electrical equipment, electrical components, high count fiber cable.
‡ Reported as up or down in price by different respondents
What Our Respondents Are Saying:
Oil and Gas Exploration, and Key Support Services:
- Tariffs continue to be a concern for our business.
- Rig counts continue to run at low levels.
- This sector returned to indicating contraction this month. While the sales/new orders, purchases, and prices paid indices showed a strong tendency towards expansion, the employment index fell well into contraction.
Construction:
- Prices for base metals have trended upward which will result in increased prices for finished products.
- The sector continues to experience strong expansion with the sales/new orders, employment, and prices paid indices continuing to show significant strength. The purchases and lead times indices improved to indicate strength.
Durable Goods Manufacturing:
- Stainless steel has been in short supply due to the vendor base hedging risk by overstocking at current prices.
- This sector moved to indicate moderate to strong expansion with the sales/new orders, production, purchases, prices paid, and lead times indices showing strength. The employment index improved to neutral.
Non-durable Goods Manufacturing:
- Natural gas prices rose again in January due to higher weather-related demand; however, we have seen considerable softening in early February.
- Feedstock prices are rising due to higher NG prices.
- Watching demand surrounding data centers.
- Olefin and polymer prices continue at a very low level.
- The price of precious metals used for catalysts (gold, silver, platinum, and palladium) continues to increase. As noted in previous months, this appears to be due to market speculation as opposed to industrial demand.
- The price of many industrial metals (copper, aluminum, and nickel) continued to increase in January.
- This sector moved to indicate modest strength during the month with the sales, production, purchases, prices paid, and lead times indices showing considerable strength. The employment and inventory indices continue to point to weakness.
Trade, Transportation, and Warehousing:
- Tariffs are influencing our business.
- We are seeing a corporate knee jerk reaction to what AI can do and the resulting layoffs of good people.
- We will have an empty pipeline for industry innovation due to the need for real-time expertise and human capital.
- This sector reported significant weakness this month with sales/new orders, employment, purchases, and inventory indices are pointing to contraction. The price paid index moved from indicating weakness to showing strength.
Professional and Business Services:
- We are not seeing any significant movement in hiring for either permanent or contract positions.
- There are continued spot shortages of technically qualified staff for some positions, but that is the exception rather than the rule.
- For the Houston Energy market, the short-term forecast remains directly tied to the price of oil. As the price stays in the $55-60/bbl range, there is not much incentive to expand the business.
- Even though the market is flat, prices paid for contractors or direct hires remain at recent levels.
- We are seeing tremendous activity with building of Data Centers and the need for “contractor” expertise in all phases of the business.
- This year is going to be a tough year for oil and gas.
- This sector continues to report expansion with the employment, purchases, and prices paid indices showing significant improvement. All other indices remain near neutral.
Trend of Underlying Indicators
Sales/New Order Index (Seasonally Adjusted)
The sales/new orders index moved back to indicating expansion during the month, rising almost three points to register at 52.5 points. Manufacturing activities provided all of this improvement with non-manufacturing ending relatively unchanged from last month.
| Sales/New Orders | Higher | Same | Lower | Net | Index |
| Aug 2025 | 14% | 82% | 4% | 10% | 55.6 |
| Sep 2025 | 11% | 86% | 3% | 8% | 55.6 |
| Oct 2025 | 16% | 79% | 5% | 11% | 60.8 |
| Nov 2025 | 11% | 83% | 6% | 5% | 54.4 |
| Dec 2025 | 11% | 74% | 15% | -4% | 49.9 |
| Jan 2026 | 18% | 72% | 10% | 8% | 52.5 |
Production Index (Seasonally Adjusted)
The production index improved modestly to 52.4 points. Non-manufacturing respondents reported just below neutral, while manufacturing swung from significant contracting to strong expansion.
| Production | Higher | Same | Lower | Net | Index |
| Aug 2025 | 10% | 87% | 3% | 7% | 52.9 |
| Sep 2025 | 12% | 84% | 4% | 8% | 55.2 |
| Oct 2025 | 11% | 85% | 4% | 7% | 55.3 |
| Nov 2025 | 9% | 86% | 5% | 4% | 52.6 |
| Dec 2025 | 3% | 91% | 6% | -3% | 51.7 |
| Jan 2026 | 9% | 89% | 2% | 7% | 52.4 |
Employment Index (Seasonally Adjusted)
The employment index fell an additional 2.5 points to 46.7 points after only two months showing expansion. Manufacturing has reported this index as contracting for 21 months. Non-manufacturing reported contraction in this index for the second month.
| Employment | Higher | Same | Lower | Net | Index |
| Aug 2025 | 9% | 82% | 9% | 0% | 51.2 |
| Sep 2025 | 11% | 72% | 17% | -6% | 48.5 |
| Oct 2025 | 8% | 83% | 9% | -1% | 50.3 |
| Nov 2025 | 9% | 83% | 8% | 1% | 51.2 |
| Dec 2025 | 2% | 91% | 7% | -5% | 49.3 |
| Jan 2026 | 6% | 84% | 10% | -4% | 46.7 |
Purchases Index (Seasonally Adjusted)
The purchases index rose almost 3 points 53.3 points with non-manufacturing remaining near neutral and manufacturing improving to indicate significant expansion.
| Purchases | Higher | Same | Lower | Net | Index |
| Aug 2025 | 7% | 87% | 6% | 1% | 50.8 |
| Sep 2025 | 16% | 76% | 8% | 8% | 55.5 |
| Oct 2025 | 15% | 78% | 7% | 8% | 55.8 |
| Nov 2025 | 14% | 71% | 15% | -1% | 51.5 |
| Dec 2025 | 7% | 81% | 12% | -5% | 50.7 |
| Jan 2026 | 19% | 73% | 8% | 11% | 53.3 |
Prices Paid Index (Seasonally Adjusted)
The prices paid index rose almost 10 points to 60.3 points, indicating a move to strong expansion of this index. Both non-manufacturing and manufacturing reported this index near this level.
| Prices Paid | Higher | Same | Lower | Net | Index |
| Aug 2025 | 12% | 77% | 11% | 1% | 50.1 |
| Sep 2025 | 9% | 74% | 17% | -8% | 44.7 |
| Oct 2025 | 12% | 78% | 10% | 2% | 51.1 |
| Nov 2025 | 13% | 75% | 12% | 1% | 54.1 |
| Dec 2025 | 9% | 76% | 15% | -6% | 50.7 |
| Jan 2026 | 25% | 72% | 3% | 22% | 60.3 |
Trend of Underlying Indicators (Continued)
Lead Time Index (Seasonally Adjusted)
The lead times index moved further above neutral, increasing just over 1 point to 54.5. Manufacturing reported this index well above neutral while non-manufacturing reported very near neutral again during the month.
| Lead Times | Higher | Same | Lower | Net | Index |
| Aug 2025 | 8% | 90% | 2% | 6% | 53.6 |
| Sep 2025 | 7% | 90% | 3% | 4% | 51.3 |
| Oct 2025 | 8% | 87% | 5% | 3% | 52.6 |
| Nov 2025 | 2% | 89% | 9% | -7% | 47.8 |
| Dec 2025 | 4% | 94% | 2% | 2% | 53.2 |
| Jan 2026 | 8% | 88% | 4% | 4% | 54.5 |
Purchased Inventory Index (Seasonally Adjusted)
The purchased inventory index fell 4 points to just below neutral. Non-manufacturing inventories were reported as contracting at a strong pace. Manufacturing reported purchase inventories as expanding at a significant rate.
| Purchased Inventory | Higher | Same | Lower | Net | Index |
| Aug 2025 | 7% | 89% | 4% | 3% | 50.9 |
| Sep 2025 | 6% | 85% | 9% | -3% | 48.3 |
| Oct 2025 | 6% | 87% | 7% | -1% | 50.6 |
| Nov 2025 | 8% | 89% | 3% | 5% | 52.5 |
| Dec 2025 | 5% | 89% | 6% | -1% | 52.9 |
| Jan 2026 | 5% | 91% | 4% | 1% | 48.9 |
Finished Goods Inventory Index (Seasonally Adjusted)
The finished goods inventory index was unchanged at 51.2 points. A significant increase in this index for manufacturing was offset by a reduction in this index for non-manufacturing activities.
| Finished Goods Inventories | Higher | Same | Lower | Net | Index |
| Aug 2025 | 5% | 91% | 4% | 1% | 50.4 |
| Sep 2025 | 8% | 85% | 7% | 1% | 50.3 |
| Oct 2025 | 10% | 84% | 6% | 4% | 51.9 |
| Nov 2025 | 13% | 84% | 3% | 10% | 54.5 |
| Dec 2025 | 7% | 89% | 4% | 3% | 51.2 |
| Jan 2026 | 6% | 91% | 3% | 3% | 51.2 |
Houston PMI Calculation Methods
The Houston Purchasing Managers Index has been included as an integral part of the ISM-Houston Business Report since the Houston affiliate of the Institute for Supply Management started publishing this document in January 1995. The report and index are issued monthly as the primary deliverables from a survey of Houston area Supply Chain leaders regarding the status of key activities that provide insight into the strength of the economy. The respondents come from diverse organizations including construction, energy, engineering, health care, durable and non-durable goods manufacturing, financial and business services, wholesale and retail trade, and utilities related companies.
The Houston Purchasing Managers Index is determined from diffusion indices of the eight indicators of economic activity covered by the ISM-Houston Business Survey and Report. These underlying indicators are sales or new orders, production, employment, purchases, prices paid for major purchases, lead times from sellers, purchased materials inventory (raw materials and supplies), and finished goods inventories. The respondents to the survey report the direction of each of these activities as either up, the same, or down in comparison to the previous month. An index for each of these areas is then calculated by subtracting the percentage of respondents that sight a negative shift from the percentage that sight a positive shift. For indicators that are positively correlated with economic growth, this results in an underlying index that points to expansion when it is above zero. Indicators that are negatively correlated with growth point to expansion when they are below zero.
The final Houston PMI is calculated by applying optimal regression factors to each of the eight underlying indicators noted above. These regression factors are determined using standard regression techniques comparing these underlying indicators to the Houston-The Woodlands-Sugar Land Business Cycle Index (Houston BCI), which is reported monthly by the Federal Reserve Bank of Dallas. This top-level index is converted to a 0 to 100 scale to match that of the national Purchasing Managers Index® (PMI®) which is published monthly by the Institute for Supply Management® (ISM®). Readings over 50 for the HPMI generally indicate manufacturing expansion in Houston in the near term and readings below 50 show coming manufacturing contraction.
It is important to note that the manufacturing breakeven HPMI does not equate to the breakeven point for the overall Houston economy. ISM-Houston periodically reviews the capability of its correlations and adjusts the regression factors when appropriate. The most recent revision occurred in 2018 after it was determined that changes in the Houston economy over the previous decade had shifted the intercept of the correlation, causing a neutral Houston PMI to no longer align with a neutral Houston BCI. A Houston PMI of 45 points now equates to a neutral Houston economy as measured by the Houston BCI. A similar offset between the National PMI and the National economy has existed for some time.
Use of ISM-Houston Business Report Content
All information included in this report is protected under copyright law, and ISM-Houston reserves all rights to this content. ISM-Houston grants a limited, revocable license for personal, non-commercial use, including access, printing, and display of content. Requests for permission to reproduce or redistribute the ISM-Houston Business Report content should be directed to the ISM-Houston Business Survey Committee at hpmi@ism-houston.org.
ISM-Houston assumes no liability, obligation, or responsibility for the accuracy, completeness, or timeliness of the information contained herein. This includes any errors, omissions, or delays in providing the report. Furthermore, ISM-Houston shall not be liable for any damages, whether direct, incidental, consequential, or special, arising from the use or reliance on the information provided in this report.
ISM-Houston Business Report Background
The ISM-Houston Purchasing Manager Report has provided some of the best information regarding what is happening in the Greater Houston area economy for over 25 years. It delivers significant analytical data along with a summary of what Houston area Supply Chain Leaders are saying about the economy and is subscribed to by a wide range of global business leaders, economists, researchers, and reporters.
The report and index are published monthly as the primary deliverables from a survey of Houston area Supply Chain professionals. These highly engaged leaders provide information on key activities that are related to the strength of the economy. They come from diverse organizations including construction, energy, engineering, health care, durable and non-durable goods manufacturing, financial and business services, wholesale and retail trade, and utilities related companies.
We are always looking to improve our coverage of the industries that make up our economy. Please join us to help make our results even more representative of what’s happening in Houston by completing this signup form.