
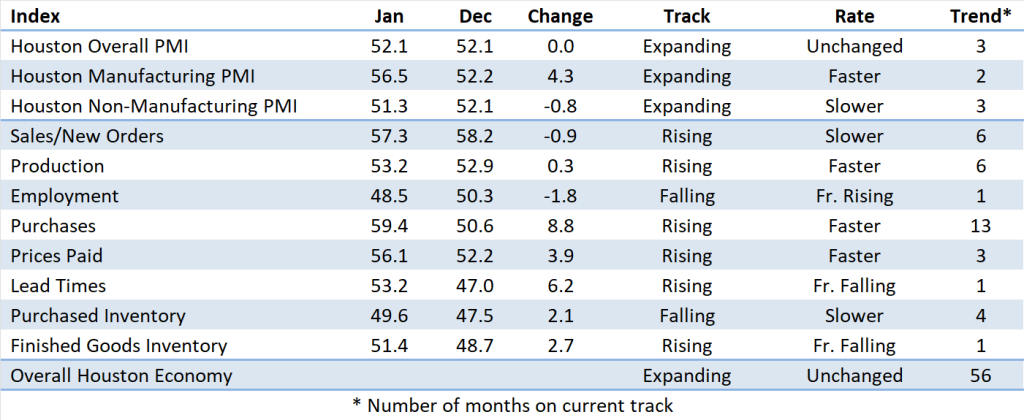
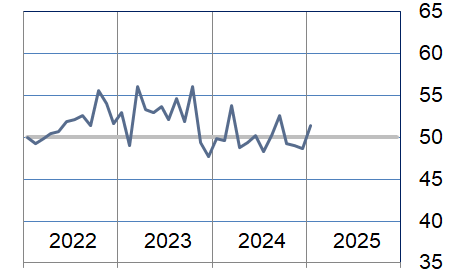
(Houston, Texas) – According to Houston area supply chain executives, economic activity in Houston expanded for a third month in January, with manufacturing expanding at a strong rate and non-manufacturing indicating moderate expansion. The overall economy expanded for the 56th month.
The Houston Purchasing Managers Index was flat at 52.1 points. The sales/new orders and lead times indices, two of the three indicators with a strong positive correlation with the economy, both pointed toward expansion in January. The sales/new orders index dropped 0.9 points to 57.3 points. The lead times index rose 6.2 points to 53.2 points, moving from contraction to expansion. The third indicator with a strong positive correlation, employment, moved from indicating expansion to contraction, dropping 1.8 points to 48.5 points. The finished goods inventory index, the underlying indicator that has the strongest inverse correlation with economic activity, increased 2.7 points to 51.4 points.
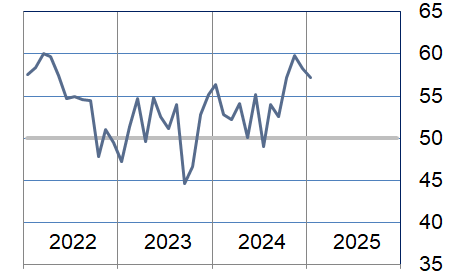
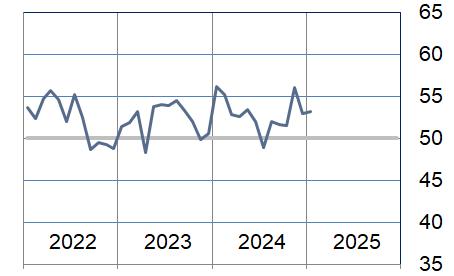
The Houston Manufacturing PMI rose an additional 4.3 points during the month to a strong 56.5 points, indicating a higher level of expansion. The nonmanufacturing PMI decreased 0.8 points to 51.3 points, continuing to point to very moderate expansion. The three-month forecast for the overall, manufacturing, and nonmanufacturing PMIs indicate that they should stay close to their current levels. The six-month index forecasts imply that employment will remain stable and sales/new orders will strengthen.
On an industry specific basis, construction, nondurable goods manufacturing, trade/transportation/warehousing, and durable goods manufacturing reported strong expansion. Oil and gas continued to show contraction.
Click here for the hard copy version of the report.
Indices at a Glance
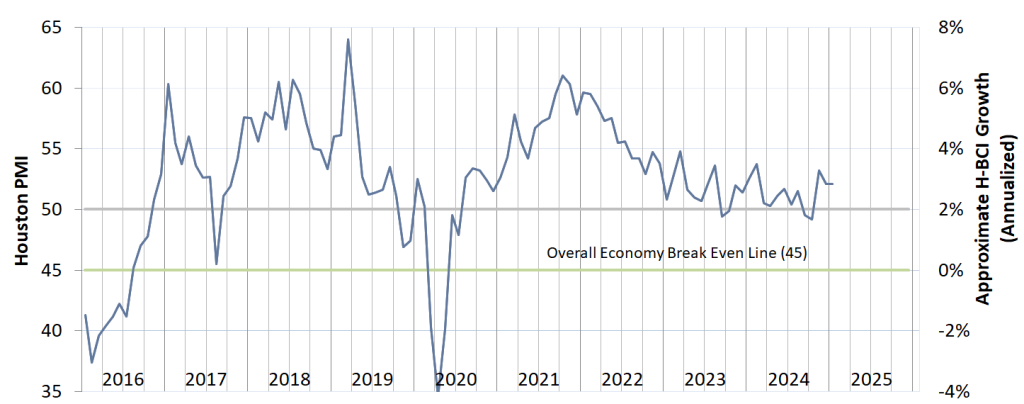
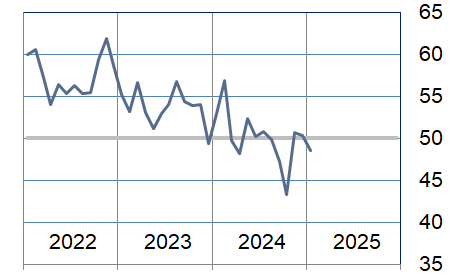
Houston PMI Trend
Houston PMI readings over 50 generally indicate that respondents see their activities as expanding. An HPMI above 45 normally correlates with expansion of the Houston-The Woodlands-Sugar Land Business Cycle Index (H-BCI).
Commodities Reported to have Notable Price Changes or to be in Short Supply
Up in Price: Labor; crude oil, motor fuels (gasoline, diesel, jet fuel), natural gas; natural gas liquids, ethane, propane, butane, isobutane, natural gasoline, naphtha; ethylene, propylene, chemicals, gases, glycols, elastomers, plastic resins, polyethylene, polypropylene; gold, copper, lumber, pipe; transformers, electronics, electrical gear and components, polymer derived ceramics; ground transportation
Down in Price: Frac sand; palladium; carbon steel materials, stainless steel products, concrete, vehicles; ocean container freight
In Short Supply: Skilled labor, I&E labor; triethylene glycol, diethylene glycol; electrical gear, electrical components, generators, transformers, switchgear, medium voltage cable, automation equipment, instrumentation
‡ reported as up or down by different respondents
What our Respondents are Saying
Oil and Gas Exploration, and Key Support Services:
- We are modeling potential tariff impacts across key categories in conjunction with our partner-suppliers
- Potential tariffs and port strikes are of concern
- Texas rig counts remain stable
- This sector continued to contract in January; the sales and production indices were both reported as contracting at a slow rate; the employment index returned to showing significant contraction; the purchases and prices paid indices rose significantly, reporting strong expansion; and the lead times index recovered considerably to report near neutral
Construction:
- Competitive skilled labor and subcontractor markets are a major concern
- The impact from recently announced tariffs and speculation about future tariffs and possibly quotas are expected to result in supply chain disruptions
- This sector continued to report strong growth in January with most underlying indices reporting well above neutral
Durable Goods Manufacturing:
- US polyethylene and polypropylene prices rose again in January after hitting a low in November
- Our business activity improved considerably in January
- We continue to be uncertain about how new administration policies will affect our business
- Durable goods returned to indicating expansion in January with the sales/new orders, purchases, prices paid, and lead times indices reporting well above neutral; production continues to be reports below neutral; employment came in near neutral
Non-durable Goods Manufacturing:
- Refinery rates fell considerably in January
- Olefins cracker feedstock pricing rose again in January
- This sector reported stronger expansion in January with the sales, production, purchases, prices paid, and lead times indices expanding at a very healthy pace; the employment index came in near neutral
Wholesale and Retail Trade:
- Imported manufactured goods prices are rising in anticipation of potential import tariffs
- Container freight rates from Asia are at their lowest level since early 2024
- This sector’s performance indicated strong expansion for the month of January with the sales/new orders, purchases, and prices paid indices reporting strength; lead times are falling; all other indices came in near neutral
Transportation and Warehousing:
- Air passenger traffic hit record highs in 2024, both nationally and in Houston
- Houston air cargo traffic for Houston in 2024 came in just short of its 2022 record level
- This sector showed strong expansion for the month of January with the sales/new orders, purchases, prices paid, and lead times indices all showing significant strength; employment was reported near neutral
Professional and Business Services:
- We are in a wait and see mode until the impacts of the changes in national leadership become clearer
- Very stable employment market for the moment
- We see direct hire and professional contract services picking up during the 1st and 2nd quarter; prices are trending up
- This sector’s performance fell to neutral during the month with all underlying indices reporting near this level
Trend of Underlying Indicators
The Houston PMI is based on diffusion indices for eight underlying indicators. The net value of each indicator is simply the percentage of respondents who cite a positive shift from the previous month minus the percentage who cite a negative shift. The diffusion index is calculated based on the percent of respondents reporting higher results plus one-half of those responding the same with seasonal adjustments to the Sales/New Orders, Production, Employment, and Prices Paid indices based on an X13 ARIMA forecast. Values above 50 for Sales/New Orders, Production, Employment, Prices Paid, and Lead Times generally point towards expansion and values below 50 signal contraction. Note that the Prices Paid Index may not follow this trend late in an economic expansion. The Inventory measures have an inverse correlation at most forecast horizons, meaning that values below 50 point to expansion and values above point to contraction. The Purchases index is inversely correlated with economic activity at the three-month forecast horizon.
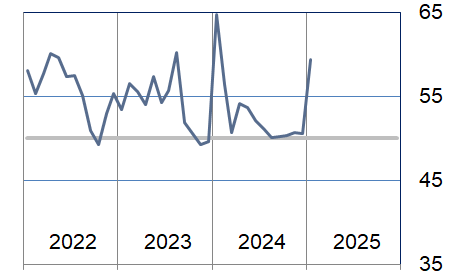
Sales/New Orders (Seasonally Adjusted)
The sales/new orders index indicated continued strong expansion in January with manufacturing expanding at a very good pace and nonmanufacturing expanding at a slightly slower rate.
| Higher | Same | Lower | Net | Index | |
| Aug/24 | 10% | 85% | 5% | 5% | 54.0 |
| Sep/24 | 11% | 82% | 7% | 4% | 52.6 |
| Oct/24 | 18% | 74% | 8% | 10% | 57.1 |
| Nov/24 | 19% | 74% | 7% | 12% | 59.8 |
| Dec/24 | 18% | 76% | 6% | 12% | 58.2 |
| Jan/25 | 22% | 74% | 4% | 18% | 57.3 |
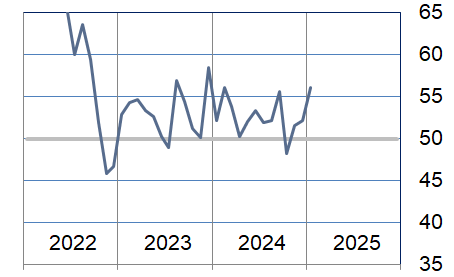
Production Index (Seasonally Adjusted)
The production index showed continued moderate expansion in January with manufacturing expanding at a very strong rate and nonmanufacturing running near neutral.
| Higher | Same | Lower | Net | Index | |
| Aug/24 | 9% | 87% | 4% | 5% | 52.0 |
| Sep/24 | 8% | 87% | 5% | 3% | 51.6 |
| Oct/24 | 8% | 89% | 3% | 5% | 51.5 |
| Nov/24 | 14% | 80% | 6% | 8% | 56.1 |
| Dec/24 | 10% | 85% | 5% | 5% | 52.9 |
| Jan/25 | 13% | 82% | 5% | 8% | 53.2 |
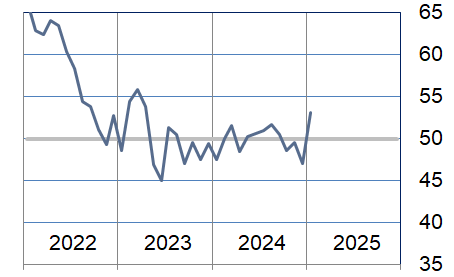
Employment Index (Seasonally Adjusted)
The employment index was reported near neutral for both manufacturing and nonmanufacturing.
| Higher | Same | Lower | Net | Index | |
| Aug/24 | 5% | 86% | 9% | -4% | 49.9 |
| Sep/24 | 4% | 87% | 9% | -5% | 47.2 |
| Oct/24 | 4% | 80% | 16% | -12% | 43.4 |
| Nov/24 | 8% | 85% | 7% | 1% | 50.7 |
| Dec/24 | 6% | 91% | 3% | 3% | 50.3 |
| Jan/25 | 3% | 94% | 3% | 0% | 48.5 |
Purchases Index (Not Seasonally Adjusted)
The purchases index moved from near neutral to expanding at a fast rate. Nonmanufacturing expanded at a modest rate and manufacturing expanded at a very fast pace.
| Higher | Same | Lower | Net | Index | |
| Aug/24 | 8% | 84% | 8% | 0% | 50.1 |
| Sep/24 | 7% | 86% | 7% | 0% | 50.3 |
| Oct/24 | 9% | 83% | 8% | 1% | 50.3 |
| Nov/24 | 9% | 84% | 7% | 2% | 50.7 |
| Dec/24 | 7% | 87% | 6% | 1% | 50.6 |
| Jan/25 | 25% | 73% | 2% | 23% | 59.4 |
Prices Paid Index (Seasonally Adjusted)
The prices paid index expanded at a higher rate in January. As with purchases, nonmanufacturing expanded at a modest rate and manufacturing expanded at a very fast pace.
| Higher | Same | Lower | Net | Index | |
| Aug/24 | 9% | 85% | 6% | 3% | 52.2 |
| Sep/24 | 12% | 86% | 2% | 10% | 55.6 |
| Oct/24 | 3% | 95% | 2% | 1% | 48.3 |
| Nov/24 | 9% | 87% | 4% | 5% | 51.6 |
| Dec/24 | 13% | 82% | 5% | 8% | 52.2 |
| Jan/25 | 15% | 83% | 2% | 13% | 56.1 |
Lead Times Index (Not Seasonally Adjusted)
The lead times index returned to expanding in January. The manufacturing sector expanded at a fast rate. Nonmanufacturing reported near neutral.
| Higher | Same | Lower | Net | Index | |
| Aug/24 | 8% | 88% | 4% | 4% | 51.7 |
| Sep/24 | 4% | 93% | 3% | 1% | 50.6 |
| Oct/24 | 2% | 93% | 5% | -3% | 48.6 |
| Nov/24 | 3% | 93% | 4% | -1% | 49.6 |
| Dec/24 | 2% | 90% | 8% | -6% | 47.0 |
| Jan/25 | 5% | 91% | 4% | 1% | 53.2 |
Purchased Inventory Index (Not Seasonally Adjusted)
The finished goods inventory index returned to modest expansion with nonmanufacturing reporting near neutral and manufacturing indicating strong expansion.
| Higher | Same | Lower | Net | Index | |
| Aug/24 | 7% | 89% | 4% | 3% | 51.4 |
| Sep/24 | 7% | 89% | 4% | 3% | 51.4 |
| Oct/24 | 4% | 89% | 7% | -3% | 48.6 |
| Nov/24 | 2% | 94% | 4% | -2% | 48.8 |
| Dec/24 | 2% | 91% | 7% | -5% | 47.5 |
| Jan/25 | 5% | 93% | 2% | 3% | 49.6 |
Finished Goods Inventory Index (Not Seasonally Adjusted)
The finished goods inventory index contracted in December. The nonmanufacturing sector was just below neutral. The manufacturing sector also contracted.
| Higher | Same | Lower | Net | Index | |
| Aug/24 | 5% | 91% | 4% | 1% | 50.3 |
| Sep/24 | 7% | 91% | 2% | 5% | 52.6 |
| Oct/24 | 4% | 91% | 5% | -1% | 49.3 |
| Nov/24 | 3% | 93% | 4% | -1% | 49.1 |
| Dec/24 | 2% | 94% | 4% | -2% | 48.7 |
| Jan/25 | 5% | 93% | 2% | 3% | 51.4 |
Projections for Key Long-Term Indicators
In addition to the current status of business activities, respondents to the ISM-Houston Business Survey also provide feedback on their view of the direction of the sales/new orders and employment indices six months into the future.
Six-Month Projection of the Sales/New Orders Index
The 6-month forecasted sales/new orders index moved to pointing to very strong expansion near term. Both manufacturing and nonmanufacturing reported at this level.
| Higher | Same | Lower | Net | Index | |
| Aug/24 | 16% | 79% | 5% | 11% | 54.2 |
| Sep/24 | 7% | 86% | 7% | 0% | 46.8 |
| Oct/24 | 9% | 83% | 8% | 1% | 47.7 |
| Nov/24 | 9% | 84% | 7% | 2% | 49.1 |
| Dec/24 | 7% | 87% | 6% | 1% | 52.2 |
| Jan/25 | 25% | 73% | 2% | 23% | 56.5 |
Finished Goods Inventory Index (Not Seasonally Adjusted)
The 6-month forecasted employment index was reported just above neutral for both manufacturing and nonmanufacturing.
| Higher | Same | Lower | Net | Index | |
| Aug/24 | 9% | 84% | 7% | 2% | 50.9 |
| Sep/24 | 11% | 79% | 10% | 1% | 50.0 |
| Oct/24 | 6% | 87% | 7% | -1% | 49.5 |
| Nov/24 | 15% | 80% | 5% | 10% | 54.0 |
| Dec/24 | 14% | 81% | 5% | 9% | 52.1 |
| Jan/25 | 13% | 82% | 5% | 8% | 51.3 |
Background on the ISM-Houston Business Report and HPMI Calculation Methods
The Houston Purchasing Managers Index has been included as an integral part of the ISM-Houston Business Report since the Houston chapter of the Institute for Supply Management started publication of this document in January 1995. The report and index are published monthly as the primary deliverables from a survey of Houston area Supply Chain leaders regarding the status of key activities believed to provide insight into the strength of the economy. The respondents come from diverse organizations including construction, energy, engineering, health care, durable and non-durable goods manufacturing, financial and business services, wholesale and retail trade, and utilities related companies.
The Houston Purchasing Managers Index is determined from diffusion indices of the eight indicators of economic activity covered by the ISM-Houston Business Survey and Report. These underlying indicators are sales or new orders, production, employment, purchases, prices paid for major purchases, lead times from sellers, purchased materials inventory (raw materials and supplies), and finished goods inventories. The respondents to the survey report the direction of each these activities as either up, the same or down in comparison to the previous month. An index for each of these areas is then calculated by subtracting the percentage of respondents that sight a negative shift from the percentage that sight a positive shift. For indicators that are positively correlated with economic growth, this results in an underlying index that points to expansion when it is above zero. Indicators that are negatively correlated with growth point to expansion when they are below zero.
The final Houston PMI is calculated by applying optimal regression factors to each of the eight underlying indicators noted above. These regression factors are determined using standard regression techniques comparing these underlying indicators to the Houston-The Woodlands-Sugar Land Business Cycle Index (Houston BCI), which is reported on a monthly basis by the Federal Reserve Bank of Dallas. This top-level index is converted to a 0 to 100 scale to match that of the national Purchasing Managers Index® (PMI®) which is published monthly by the Institute for Supply Management® (ISM®). Readings over 50 for the HPMI generally indicate manufacturing expansion in the Houston in the near term and readings below 50 show coming manufacturing contraction.
It is important to note that the manufacturing breakeven HPMI does not equate to the breakeven point for the overall Houston economy. ISM-Houston periodically reviews the capability of its correlations and adjusts the regression factors when appropriate. The most recent revision occurred as a result of a review undertaken during the third quarter of 2018, which determined that changes in the Houston economy over the last decade have shifted the intercept of the correlation, causing a neutral Houston PMI to no longer align with a neutral Houston BCI. A Houston PMI of 45 points now equates to a neutral Houston economy as measured by the Houston BCI. A similar offset between the National PMI and the National economy has existed for some time.
Use of ISM-Houston Business Report Content
All information contained in this report is protected by copyright laws and ISM-Houston retains all rights to this Content. ISM-Houston hereby grants you a limited, revocable license to access, print, and display this Content solely for your personal, non-commercial use. Requests for permission to reproduce or redistribute ISM-Houston Business Report Content can be made by contacting the ISM-Houston Business Survey Committee at hpmi@ism-houston.org.
ISM-Houston shall not have any liability, duty, or obligation for or relating to the ISM-Houston Business Report Content or other information contained herein, any errors, inaccuracies, omissions or delays in providing any ISM-Houston Business Report Content, or for any actions taken in reliance thereon. In no event shall ISM-Houston be liable for any special, incidental, or consequential damages, arising out of the use of the ISM-Houston Business Report.