
For release February 12, 2023
January ISM-Houston Business Report
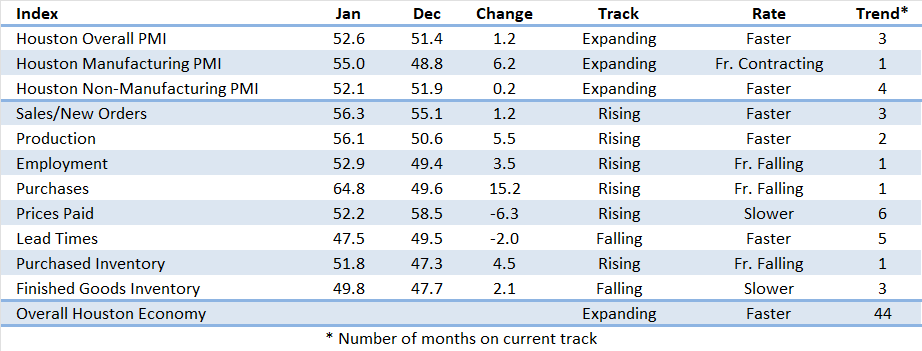
Houston PMI at 52.6 (up 1.2 points)
Sales/New Orders Expanding
Production Expanding
Employment Expanding
Prices Paid Expanding
Lead Times Contracting
Finished Goods Inventories Contracting
(Houston, Texas) – According to Houston area supply chain executives economic activity in Houston showed positive results in January with the nonmanufacturing sectors expanding at a faster pace and the manufacturing sectors showing expansion for the first time in three quarters.
The Houston Purchasing Managers Index expanded 1.2 points to 52.6. Two of the three indicators with a strong positive correlation with economic activity, sales/new orders and employment, are pointing to expansion. The third indicator with a strong positive correlation (lead times) continues to give a modest signal for contraction. The sales/new orders index rose 1.2 points to 56.3. The employment index rose 3.5 points to 52.9, indicating expansion after a single month of contraction in December. Prior to December, the employment index enjoyed a 34-month trend of expansion. The lead times index fell 2.0 points to 47.5. The finished goods inventory index, the underlying indicator that has the strongest inverse correlation with economic activity, rose 2.1 points to 49.8.
The Houston Manufacturing PMI rose 6.2 points to 55.0, providing a signal for expansion in this sector. The nonmanufacturing PMI fell 0.9 points to 52.2, showing a slowing indication of expansion for the industries in this sector.
On an industry specific basis construction, manufacturing, trade/transportation/warehousing, and professional and management services reported strong expansion. Real estate, health care, and oil & gas reported moderate weakness.
Click here to see the PDF version of the full report.
Indices at a Glance
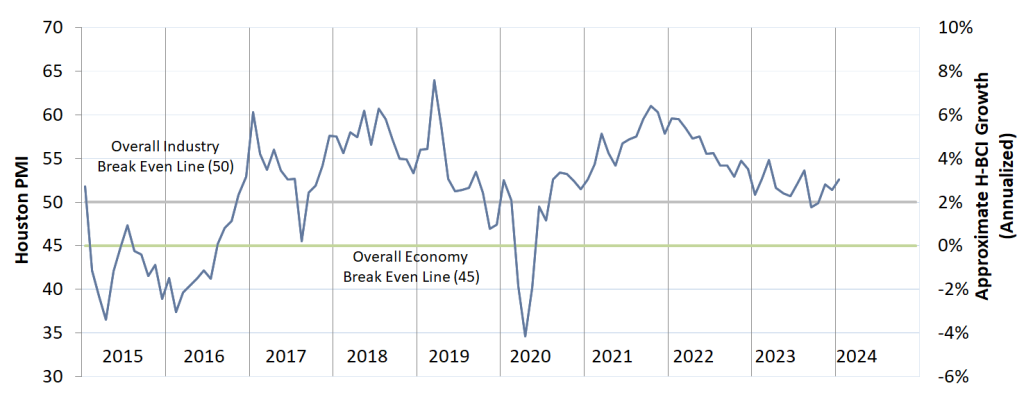
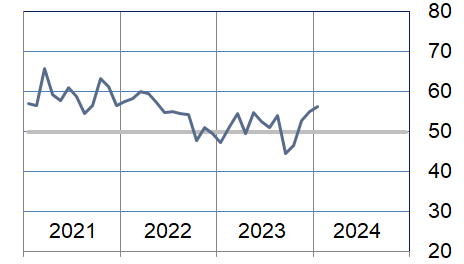
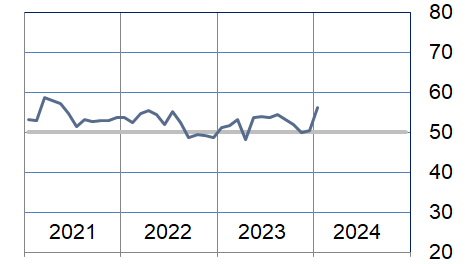
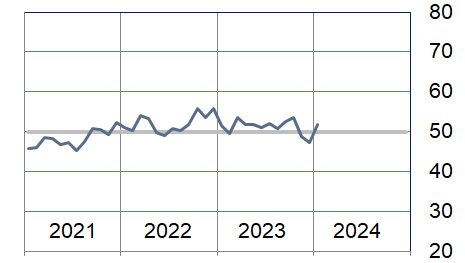
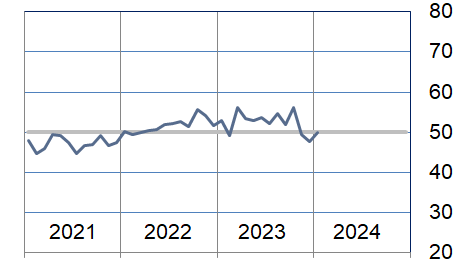
Houston PMI Trend
Houston PMI readings over 50 generally indicate that respondents see their activities as expanding. An HPMI above 45 normally correlates with expansion of the Houston-The Woodlands-Sugar Land Business Cycle Index (H-BCI).
Commodities Reported to have Notable Price Changes or to be in Short Supply
Up in Price: Rig labor, clinical labor, international labor; gasoline, jet fuel, natural gas‡; natural gas liquids, propane, normal butane, isobutane, glycol, oil field chemicals, specialty chemicals, elastomers, polyethylene resins; platinum, palladium; premium alloy steel, iron ore (62% FE); compressors, electrical gear, instrumentation, transformers, electronics; ocean container freight.
Down in Price: Onshore labor; proppant; natural gas‡; neoprene, nitrile rubber compounds, industrial gasses (hydrogen, nitrogen, oxygen), hazardous chemicals; platinum, palladium, molybdenum, iron ore (62% FE); fabricated equipment, oil country tubular goods (OCTG), steel; electronics, lumber.
In Short Supply: Specialty labor; fluoropolymers (PFAs); Inconel, stainless steel flat bar; gas engines, power suppliers, compressors, generators, electrical steel, electrical panels, instrumentation electronics, electrical equipment.
‡ reported as up or down by different respondents
What our Respondents are Saying
Oil and Gas Exploration, and Key Support Services:
- Offshore rig and drilling services remain tighter than onshore market. Expect pricing pressure in 1H24.
- Onshore, OCTG and related drilling services were flat and trending on single digit deflation through 1H24.
- Politics and regulation causing some inflation. Red sea impact in logistics as well as Panama Canal.
- Improved supply chain predictability versus prior years, despite Red Sea and Panama Canal concerns.
- Oil prices seem to be steady and companies are not investing in people and staff as they have done in the past. Probably as quiet a market place as I have seen in some time.
- This sector moved from indicating expansion to contraction during the month driven primarily by the employment index falling into significant contraction and deepening contraction in the lead times index. The prices paid index also fell significantly to near to near neutral. The production index continues to point to significant expansion.
Construction:
- Supply chains have become more predictable than at any time since COVID.
- This sector continues to show modest to strong growth. The employment and purchase indices continue to show strength while the prices paid index moved from contraction to significant expansion. The sales/new orders index is indicating modest contraction.
Durable Goods Manufacturing:
- This sector moved from contraction to modest expansion during the month driven by significant improvements in the production and purchases indices. The prices paid index is the only indicator pointing to significant contraction while the sales/new orders index continues to indicate modest contraction.
Non-durable Goods Manufacturing:
- Prices of materials and equipment are approaching a low point, indicating that the surge in prices observed in 2021-2022 has concluded. However, prices have stabilized at a higher level. The market outlook for the next 12 months mostly suggests deflation or moderate trends.
- Cracking feedstock prices began to climb in early February.
- Refinery rates are falling as of late January.
- This sector’s performance improved from neutral to moderately strong expansion driven by falling finished goods inventories and significant improvement to the sales/new orders, production, and employment indices. The production index made a significant shift from steep contraction to moderate expansion.
Trade, Transportation, and Warehousing:
- Passenger traffic into Houston hit a record 60.1 million in 2023, exceeding the pre-pandemic high set in 2019.
- The economy is being boosted due to continued high military spend which is increasing the need for industrial and process chemicals.
- This sector’s performance improved modestly further above neutral with the sales/new orders and purchases indices showing significant strengthening. The employment index fell to just below neutral. All other indices came in near neutral.
Professional and Business Services:
- We continue to have a flat market. Not many companies adding to staff and not many people looking for a “change in Venue.”
- Over the past couple of weeks, there are indications that perhaps activity will moderately pick up in this area.
- In the People hiring side of business, very flat demand and supply situation which results in very little change in what people are asking and what companies are willing to pay to fill open staff positions. That said, not many firms creating new positions.
- This sector indicated slight expansion again this month with all indices indicating no real change. The employment index rose from slight contraction to modest expansion.
Health Care:
- Inventories at our suppliers is plentiful. I think in healthcare, there is a pull back in an effort to save money and companies are ordering less and managing their current inventory process more. We are in a period of looking for pennies everywhere.
- Second year of government cuts on Medicare coming in April. Whole sector is bracing for it and cost cutting is in full mode. Some are doing layoffs. Some are not backfilling. Every contract is scrutinized and we are calling suppliers asking for more concessions.
- Labor, especially clinical labor, is still a hot commodity. Suppliers are trying to get their prices up. Some are successful but we limit increases and tie it to PPI
- This sector reported contraction again during the month but approached neutral. The sales/new orders and purchases indices showed strength and the employment index improved to neutral. The lead time index indicated deep contraction in contrast with last month’s neutral results.
Trend of Underlying Indicators
The Houston PMI is based on diffusion indices for eight underlying indicators. The net value of each indicator is simply the percentage of respondents who cite a positive shift from the previous month minus the percentage who cite a negative shift. The diffusion index is calculated based on the percent of respondents reporting higher results plus one-half of those responding the same with seasonal adjustments to the Sales/New Orders, Production, Employment, and Prices Paid indices based on an X13 ARIMA forecast. Values above 50 for Sales/New Orders, Production, Employment, Prices Paid, and Lead Times generally point towards expansion and values below 50 signal contraction. Note that the Prices Paid Index may not follow this trend late in an economic expansion. The Inventory measures have an inverse correlation at most forecast horizons, meaning that values below 50 point to expansion and values above point to contraction. The Purchases index is inversely correlated with economic activity at the three-month forecast horizon.
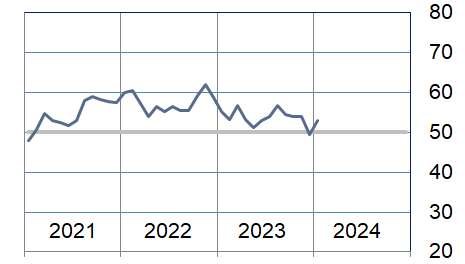
Sales/New Orders (Seasonally Adjusted)
The sales/new orders index expanded at a faster rate. Nonmanufacturing activity remained strong but was outpaced by manufacturing which rose from contracting to expanding in January.
| Higher | Same | Lower | Net | Index | |
| Aug/23 | 16% | 78% | 6% | 10% | 54.0 |
| Sep/23 | 8% | 76% | 16% | -8% | 44.6 |
| Oct/23 | 5% | 79% | 16% | -11% | 46.6 |
| Nov/23 | 8% | 84% | 8% | 0% | 52.8 |
| Dec/23 | 7% | 87% | 6% | 1% | 55.1 |
| Jan/24 | 21% | 77% | 2% | 19% | 56.3 |
Production Index (Seasonally Adjusted)
The production index rose to show moderate expansion. Nonmanufacturing sectors continued to expand at a moderate rate while manufacturing sectors reported significant expansion in this index.
| Higher | Same | Lower | Net | Index | |
| Aug/23 | 12% | 85% | 3% | 9% | 54.5 |
| Sep/23 | 11% | 84% | 5% | 6% | 53.3 |
| Oct/23 | 8% | 87% | 5% | 3% | 52.0 |
| Nov/23 | 5% | 88% | 7% | -2% | 49.9 |
| Dec/23 | 8% | 84% | 8% | 0% | 50.6 |
| Jan/24 | 13% | 86% | 1% | 12% | 56.1 |
Employment Index (Seasonally Adjusted)
The employment index moved to indicating minimal expansion with both the manufacturing and nonmanufacturing sectors at this level.
| Higher | Same | Lower | Net | Index | |
| Aug/23 | 13% | 82% | 5% | 8% | 56.8 |
| Sep/23 | 14% | 80% | 6% | 8% | 54.4 |
| Oct/23 | 7% | 91% | 2% | 5% | 53.9 |
| Nov/23 | 5% | 92% | 3% | 2% | 54.0 |
| Dec/23 | 4% | 89% | 7% | -3% | 49.4 |
| Jan/24 | 17% | 77% | 6% | 11% | 52.9 |
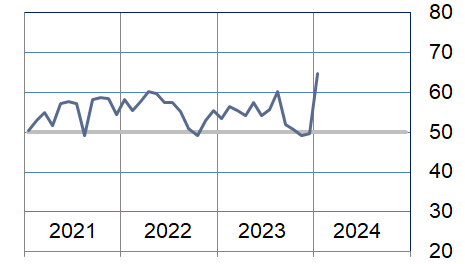
Purchases Index (Not Seasonally Adjusted)
The purchases index indicated significant expansion this month. Both manufacturing and nonmanufacturing sectors were at the same level.
| Higher | Same | Lower | Net | Index | |
| Aug/23 | 27% | 67% | 6% | 21% | 60.2 |
| Sep/23 | 21% | 62% | 17% | 4% | 51.9 |
| Oct/23 | 16% | 69% | 15% | 1% | 50.6 |
| Nov/23 | 7% | 84% | 9% | -2% | 49.3 |
| Dec/23 | 8% | 83% | 9% | -1% | 49.6 |
| Jan/24 | 32% | 65% | 3% | 29% | 64.8 |
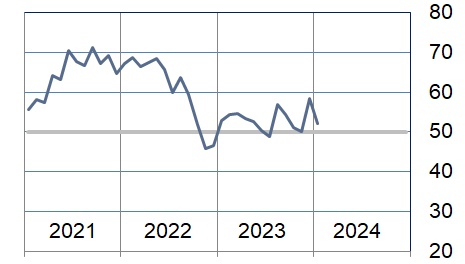
Prices Paid Index (Seasonally Adjusted)
The prices paid index indicated moderate expansion. Nonmanufacturing expanded at a slower pace while manufacturing moved back to contracting from modest expansion.
| Higher | Same | Lower | Net | Index | |
| Aug/23 | 17% | 78% | 5% | 12% | 56.9 |
| Sep/23 | 12% | 85% | 3% | 9% | 54.4 |
| Oct/23 | 8% | 90% | 2% | 6% | 51.1 |
| Nov/23 | 3% | 92% | 5% | -2% | 50.2 |
| Dec/23 | 14% | 84% | 2% | 12% | 58.5 |
| Jan/24 | 11% | 83% | 6% | 5% | 52.2 |
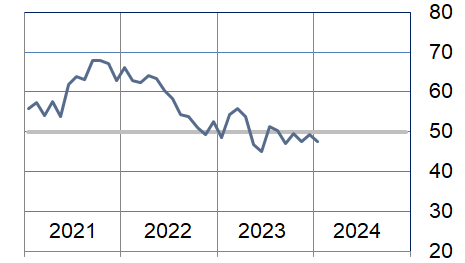
Lead Times Index (Not Seasonally Adjusted)
The lead times index fell to moderate contraction. Manufacturing returned to neutral, nonmanufacturing fell to moderately contracting.
| Higher | Same | Lower | Net | Index | |
| Aug/23 | 9% | 83% | 8% | 1% | 50.5 |
| Sep/23 | 6% | 82% | 12% | -6% | 47.1 |
| Oct/23 | 6% | 87% | 7% | -1% | 49.5 |
| Nov/23 | 4% | 87% | 9% | -5% | 47.5 |
| Dec/23 | 3% | 93% | 4% | -1% | 49.5 |
| Jan/24 | 1% | 93% | 6% | -5% | 47.5 |
Purchased Inventory Index (Not Seasonally Adjusted)
The purchased inventory index rose to expanding after two months of contraction. Both manufacturing and nonmanufacturing sectors indicated expansion with manufacturing moving from significant contraction.
| Higher | Same | Lower | Net | Index | |
| Aug/23 | 6% | 89% | 5% | 1% | 50.8 |
| Sep/23 | 10% | 85% | 5% | 5% | 52.5 |
| Oct/23 | 8% | 91% | 1% | 7% | 53.4 |
| Nov/23 | 3% | 91% | 6% | -3% | 48.8 |
| Dec/23 | 2% | 91% | 7% | -5% | 47.3 |
| Jan/24 | 5% | 93% | 2% | 3% | 51.8 |
Finished Goods Inventory Index (Not Seasonally Adjusted)
The finished goods inventory index returned to neutral. The nonmanufacturing sector indicated faster expansion while the manufacturing sector contracted but at a much slower rate.
| Higher | Same | Lower | Net | Index | |
| Aug/23 | 12% | 85% | 3% | 9% | 54.7 |
| Sep/23 | 9% | 86% | 5% | 4% | 51.9 |
| Oct/23 | 13% | 86% | 1% | 12% | 56.1 |
| Nov/23 | 5% | 89% | 6% | -1% | 49.4 |
| Dec/23 | 4% | 88% | 8% | -4% | 47.7 |
| Jan/24 | 5% | 90% | 5% | 0% | 49.8 |
Background on the ISM-Houston Business Report and HPMI Calculation Methods
The Houston Purchasing Managers Index has been included as an integral part of the ISM-Houston Business Report since the Houston chapter of the Institute for Supply Management started publication of this document in January 1995. The report and index are published monthly as the primary deliverables from a survey of Houston area Supply Chain leaders regarding the status of key activities believed to provide insight into the strength of the economy. The respondents come from diverse organizations including construction, energy, engineering, health care, durable and non-durable goods manufacturing, financial and business services, wholesale and retail trade, and utilities related companies.
The Houston Purchasing Managers Index is determined from diffusion indices of the eight indicators of economic activity covered by the ISM-Houston Business Survey and Report. These underlying indicators are sales or new orders, production, employment, purchases, prices paid for major purchases, lead times from sellers, purchased materials inventory (raw materials and supplies), and finished goods inventories. The respondents to the survey report the direction of each these activities as either up, the same or down in comparison to the previous month. An index for each of these areas is then calculated by subtracting the percentage of respondents that sight a negative shift from the percentage that sight a positive shift. For indicators that are positively correlated with economic growth, this results in an underlying index that points to expansion when it is above zero. Indicators that are negatively correlated with growth point to expansion when they are below zero.
The final Houston PMI is calculated by applying optimal regression factors to each of the eight underlying indicators noted above. These regression factors are determined using standard regression techniques comparing these underlying indicators to the Houston-The Woodlands-Sugar Land Business Cycle Index (Houston BCI), which is reported on a monthly basis by the Federal Reserve Bank of Dallas. This top-level index is converted to a 0 to 100 scale to match that of the national Purchasing Managers Index® (PMI®) which is published monthly by the Institute for Supply Management® (ISM®). Readings over 50 for the HPMI generally indicate manufacturing expansion in the Houston in the near term and readings below 50 show coming manufacturing contraction.
It is important to note that the manufacturing breakeven HPMI does not equate to the breakeven point for the overall Houston economy. ISM-Houston periodically reviews the capability of its correlations and adjusts the regression factors when appropriate. The most recent revision occurred as a result of a review undertaken during the third quarter of 2018, which determined that changes in the Houston economy over the last decade have shifted the intercept of the correlation, causing a neutral Houston PMI to no longer align with a neutral Houston BCI. A Houston PMI of 45 points now equates to a neutral Houston economy as measured by the Houston BCI. A similar offset between the National PMI and the National economy has existed for some time.
Use of ISM-Houston Business Report Content
All information contained in this report is protected by copyright laws and ISM-Houston retains all rights to this Content. ISM-Houston hereby grants you a limited, revocable license to access, print, and display this Content solely for your personal, non-commercial use. Requests for permission to reproduce or redistribute ISM-Houston Business Report Content can be made by contacting the ISM-Houston Business Survey Committee at hpmi@ism-houston.org.
ISM-Houston shall not have any liability, duty, or obligation for or relating to the ISM-Houston Business Report Content or other information contained herein, any errors, inaccuracies, omissions or delays in providing any ISM-Houston Business Report Content, or for any actions taken in reliance thereon. In no event shall ISM-Houston be liable for any special, incidental, or consequential damages, arising out of the use of the ISM-Houston Business Report.