
For release February 10, 2023
January 2023 ISM-Houston Business Report
Houston PMI at 50.8 (down 3.0 points)
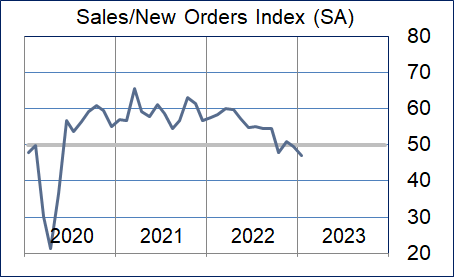
Sales/New Orders Contracting
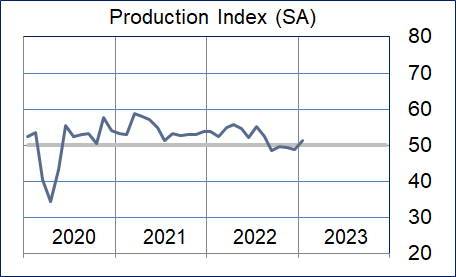
Production Expanding
Employment Expanding
Prices Paid Expanding
Lead Times Contracting
Finished Goods Inventories Expanding
(Houston, Texas) – According to Houston area supply chain executives, economic activity in Houston expanded at a significantly slower pace in January. Manufacturing sector activity fell to minimal contraction while nonmanufacturing activity slowed to very modestly expansion.
The Houston Purchasing Managers Index fell 3.0 points to 50.8. Two of the three underlying indicators that have the strongest correlation with the Houston economy, sales/new orders and lead times, are now pointing to possible weak contraction while the third, employment, continues to indicate potential expansion. The sales/new orders index fell 2.3 points to 47.2. The employment index fell 3.4 points to 55.5. The lead times index fell 4.1 points to 48.7. The Finished goods inventory index, the underlying indicator that has the strongest inverse correlation with economic activity, rose 1.4 points to 53.0, giving a modestly higher indication of contraction.
The Houston Manufacturing PMI fell 1.7 points to 48.6, giving a modest contraction signal. The non-manufacturing PMI fell 3.3 points to 51.2, showing a slower expansion rate for the industries in this sector.
On an industry specific basis, professional and management services, construction, oil & gas, and health care reported continued expansion. Manufacturing, leisure and hospitality, real estate, and trade, transportation & warehousing reported near neutral. No sector reported significant contraction.
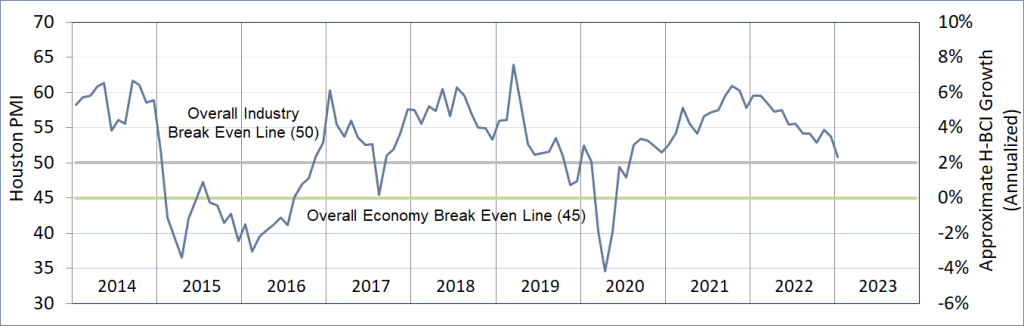
The Houston PMI provides a measure of current economic activity in the greater Houston area and a forecast of likely shifts in activity over a three-month forecast horizon. These indicators have a possible range of 0 to 100. Readings over 50 generally indicate goods producing industry expansion; readings below 50 show contraction. A PMI above 45 generally correlates with expansion of the Houston-The Woodlands-Sugar Land Business Cycle Index. The current and forecast PMI indices are based on diffusion indices for eight underlying indicators: Sales/New Orders, Production, Employment, Purchases, Prices Paid, Lead Times, Purchase Inventory, and Finished Goods Inventory.
The Houston PMI provides a measure of current economic activity in the greater Houston area and a forecast of likely shifts in activity over a three-month forecast horizon. These indicators have a possible range of 0 to 100. Readings over 50 generally indicate goods producing industry expansion; readings below 50 show contraction. A PMI above 45 generally correlates with expansion of the Houston-The Woodlands-Sugar Land Business Cycle Index. The current and forecast PMI indices are based on diffusion indices for eight underlying indicators: Sales/New Orders, Production, Employment, Purchases, Prices Paid, Lead Times, Purchase Inventory, and Finished Goods Inventory.
Click here to see the PDF version of the full report.
Indices at a Glance
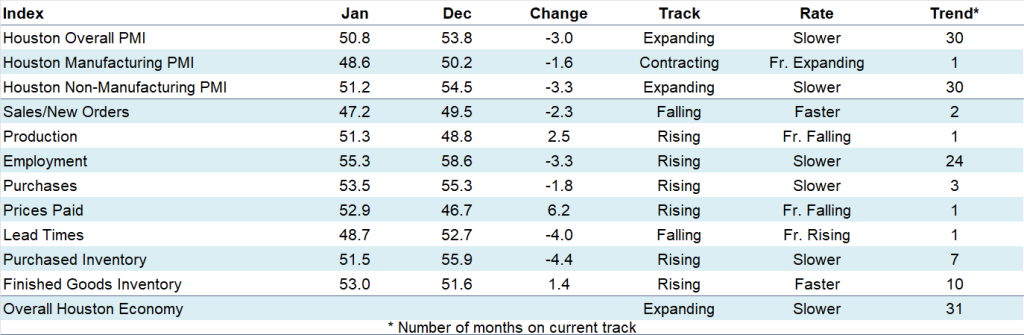
Houston PMI Trend
Houston PMI readings over 50 generally indicate that respondents see their activities as expanding. An HPMI above 45 normally correlates with expansion of the Houston-The Woodlands-Sugar Land Business Cycle Index (H-BCI).
Commodities Reported to have Notable Price Changes or to be in Short Supply
Up in Price: Technical support, engineering services, well drilling and completion services, skilled and unskilled labor; oil country tubular goods (OCTG) and rigs; motor fuels (gasoline, diesel‡, jet fuel); propane, normal butane, isobutane, natural gasoline, propylene, caustic; molybdenum for catalysts; some carbon steel pipe sizes and fittings, motors, electronics, wire and cable, electrical equipment/gear, some mechanical equipment, concrete/cement; software.
Down in Price: Oil field chemicals, proppant; natural gas, diesel‡; ethane, butadiene, MTBE; sulfuric acid; carbon and alloy steel; bulk and containerized ocean freight.
In Short Supply: Senior consultants, finance and accounting professionals, high alloy welders, skilled and unskilled labor; medical lab supplies; OCTG (casing and tubing); fluoropolymers (PFAs); motors, drives, power supplies, electrical components, cement, cement products, some mechanical components, specific sizes of pipe.
‡ reported as up or down by different respondents
What our Respondents are Saying
Oil and Gas Exploration, and Key Support Services:
- We anticipate market inflation in drilling and completion services/materials to be in the 10-20% range in 2023
- Rig counts changed minimally
- This sector reported higher growth this month with the purchases index joining the production, employment, prices paid, and lead times indices showing significant strength
Construction:
- The shortage of labor in the US continues to be a challenge across industries
- Mixed bag for construction sectors; demand still good in many areas
- Performance in this sector fell to just above neutral with significant declines in the purchases and lead times indices; the employment and prices paid indices continue to show strength while the sales/new index is pointing to contraction
Durable Goods Manufacturing:
- This sector strengthened further this month with the sales/new orders, production, and purchases indices pointing to greater expansion; the employment, prices paid, and lead times indices remained near neutral; inventories are still too high
Non-durable Goods Manufacturing:
- Multiple headwinds anticipated in terms of new orders and related demand
- Energy situation in Europe continues to be of concern
- Supplier backlogs are high but anticipated to be balanced in 2023
- Job reductions are anticipated to manage structural costs
- Polymer prices were relatively stable during the month
- This sector fell further below neutral with the sales/new orders, production, purchases, lead times indices remaining well below neutral; the prices paid index returned to neutral while the employment index remained strong
Trade, Transportation, and Warehousing:
- This sector’s performance fell to near neutral during the month with all indices reporting at or near neutral
Real-Estate Services:
- Sales have stabilized (New homes)
- This sector improved to modest contraction with housing improving to near neutral; industrial and retail real estate remained strong
Leisure and Hospitality:
- This sector’s performance fell to near neutral during the month with all indices reporting near this level
Professional and Business Services:
- Employment is good and availability of people is tight
- We don’t see a very, very tight market but certainly see a market that takes work to find good people
- Prices for hourly and direct hire professional workers remains very stable
- Compared to a couple of years ago, people are demanding and getting more pay
- Prices have remained steady and there continues to be people in the market for new opportunities
- We are seeing a return to the office and remote work is being reduced
- Anyone looking to change jobs is putting remote/hybrid as a high priority for making a change
- This sector’s performance fell to just above neutral during the month; the prices paid index joined the employment index in showing strength while the sales/new orders index fell well below neutral
Health Care:
- Healthcare in Houston is robust
- Healthcare services continue to move down the continuum of care out of the hospital and into surgery/clinical day setting
- Allocations of healthcare supplies continue; production is robust but just enough; order cancellations result in moving to the bottom of the pile; very important to place long lead time orders right away to get in line
- This sector strengthened from last month with the employment index joining the purchases index in indicating strong expansion; all other indices were near neutral
Trend of Underlying Indicators
The Houston PMI is based on diffusion indices for eight underlying indicators. The net value of each indicator is simply the percentage of respondents who cite a positive shift from the previous month minus the percentage who cite a negative shift. The diffusion index is calculated based on the percent of respondents reporting higher results plus one-half of those responding the same with seasonal adjustments to the Sales/New Orders, Production, Employment, and Prices Paid indices based on an X13 ARIMA forecast. Values above 50 for Sales/New Orders, Production, Employment, Prices Paid, and Lead Times generally point towards expansion and values below 50 signal contraction. Note that the Prices Paid Index may not follow this trend late in an economic expansion. The Inventory measures have an inverse correlation at most forecast horizons, meaning that values below 50 point to expansion and values above point to contraction. The Purchases index is inversely correlated with economic activity at the three-month forecast horizon.
Sales/New Orders
The sales/new orders index fell further below neutral with both the manufacturing and nonmanufacturing sectors coming in at similar levels to last month
| Higher | Same | Lower | Net | Index | |
| Aug/22 | 14% | 82% | 4% | 10% | 54.6 |
| Sep/22 | 17% | 75% | 8% | 9% | 54.4 |
| Oct/22 | 6% | 81% | 13% | -7% | 47.8 |
| Nov/22 | 14% | 70% | 16% | -2% | 51.1 |
| Dec/22 | 8% | 78% | 14% | -6% | 49.5 |
| Jan/23 | 7% | 85% | 8% | -1% | 47.2 |
Production Index
The production index rose to back above neutral. Nonmanufacturing returned to modest expansion while manufacturing remained well below neutral.
| Higher | Same | Lower | Net | Index | |
| Aug/22 | 10% | 85% | 5% | 5% | 52.5 |
| Sep/22 | 6% | 85% | 9% | -3% | 48.6 |
| Oct/22 | 7% | 85% | 8% | -1% | 49.5 |
| Nov/22 | 8% | 82% | 10% | -2% | 49.3 |
| Dec/22 | 5% | 84% | 11% | -6% | 48.8 |
| Jan/23 | 9% | 84% | 7% | 2% | 51.3 |
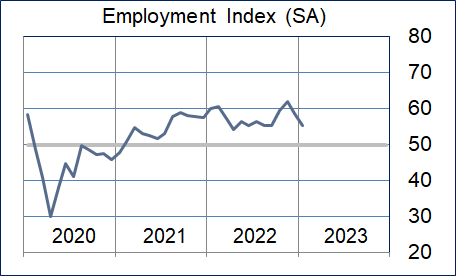
Employment Index
This index fell modestly again this month with nonmanufacturing reporting minimally slower growth and manufacturing indicating modest expansion at a similar level to last month.
| Aug/22 | 14% | 84% | 2% | 12% | 55.4 |
| Sep/22 | 15% | 83% | 2% | 13% | 55.4 |
| Oct/22 | 20% | 78% | 2% | 18% | 59.3 |
| Nov/22 | 23% | 74% | 3% | 20% | 61.9 |
| Dec/22 | 16% | 81% | 3% | 13% | 58.6 |
| Jan/23 | 14% | 86% | 0% | 14% |
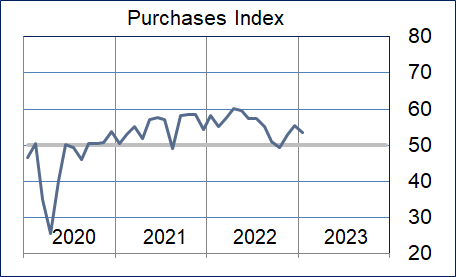
Purchases Index
The purchases index showed moderately slower expansion. Nonmanufacturing activities fell to near neutral while manufacturing performance returned to indicating modest expansion.
| Aug/22 | 19% | 74% | 7% | 12% | 55.1 |
| Sep/22 | 11% | 84% | 5% | 6% | 51.0 |
| Oct/22 | 8% | 81% | 11% | -3% | 49.2 |
| Nov/22 | 14% | 77% | 9% | 5% | 53.0 |
| Dec/22 | 13% | 77% | 10% | 3% | 55.3 |
| Jan/23 | 10% | 87% | 3% | 7% | 53.4 |
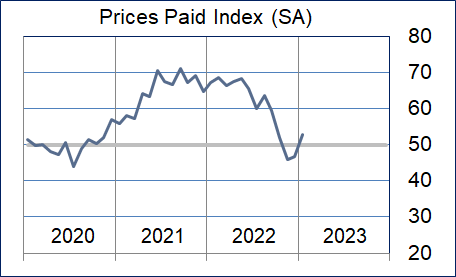
Prices Paid Index
The purchases index returned to indicating growth with both nonmanufacturing and manufacturing reporting modest growth.
| Higher | Same | Lower | Net | Index | |
| Aug/22 | 29% | 67% | 4% | 25% | 63.6 |
| Sep/22 | 21% | 76% | 3% | 18% | 59.4 |
| Oct/22 | 16% | 72% | 12% | 4% | 51.9 |
| Nov/22 | 12% | 67% | 21% | -9% | 45.9 |
| Dec/22 | 7% | 76% | 17% | -10% | 46.7 |
| Jan/23 | 7% | 91% | 2% | 5% | 52.9 |
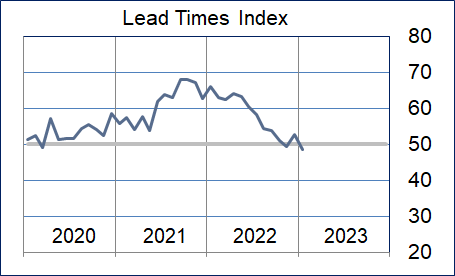
Lead Times Index
This index fell back below neutral during the month lead by a significant drop in performance in nonmanufacturing sectors. Manufacturing sectors fell further below neutral.
| Aug/22 | 17% | 76% | 7% | 10% | 54.4 |
| Sep/22 | 15% | 77% | 8% | 7% | 53.8 |
| Oct/22 | 10% | 80% | 10% | 0% | 51.1 |
| Nov/22 | 9% | 80% | 11% | -2% | 49.3 |
| Dec/22 | 11% | 81% | 8% | 3% | 52.7 |
| Jan/23 | 4% | 89% | 7% | -3% | 48.7 |
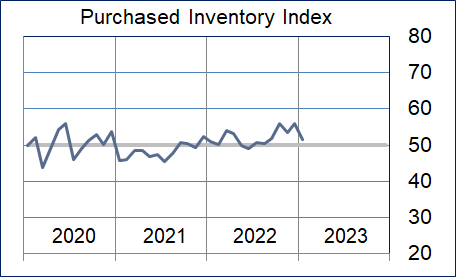
Purchased Inventory Index
The purchased inventory index fell to near neutral with both the nonmanufacturing and manufacturing sectors falling to near this level.
| Higher | Same | Lower | Net | Index | |
| Aug/22 | 9% | 84% | 7% | 2% | 50.4 |
| Sep/22 | 6% | 88% | 6% | 0% | 51.9 |
| Oct/22 | 8% | 88% | 4% | 4% | 55.9 |
| Nov/22 | 9% | 86% | 5% | 4% | 53.5 |
| Dec/22 | 7% | 90% | 3% | 4% | 55.9 |
| Jan/23 | 4% | 95% | 1% | 3% | 51.5 |
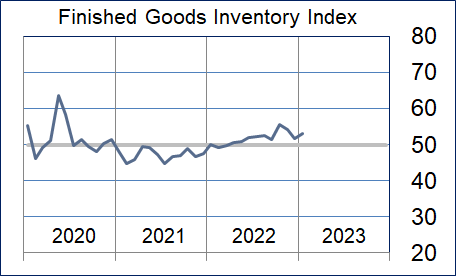
Finished Goods Inventory Index
The finished goods inventory index rose modestly lead by a significant increase in the manufacturing sectors. The nonmanufacturing sectors fell to just above neutral.
| Higher | Same | Lower | Net | Index | |
| Aug/22 | 9% | 86% | 5% | 4% | 52.6 |
| Sep/22 | 7% | 87% | 6% | 1% | 51.4 |
| Oct/22 | 11% | 81% | 8% | 3% | 55.7 |
| Nov/22 | 14% | 82% | 4% | 10% | 54.1 |
| Dec/22 | 10% | 85% | 5% | 5% | 51.6 |
| Jan/23 | 6% | 94% | 0% | 6% | 53.0 |
Background on the ISM-Houston Business Report and HPMI Calculation Methods
The Houston Purchasing Managers Index has been included as an integral part of the ISM-Houston Business Report since the Houston chapter of the Institute for Supply Management started publication of this document in January 1995. The report and index are published monthly as the primary deliverables from a survey of Houston area Supply Chain leaders regarding the status of key activities believed to provide insight into the strength of the economy. The respondents come from diverse organizations including construction, energy, engineering, health care, durable and non-durable goods manufacturing, financial and business services, wholesale and retail trade, and utilities related companies.
The Houston Purchasing Managers Index is determined from diffusion indices of the eight indicators of economic activity covered by the ISM-Houston Business Survey and Report. These underlying indicators are sales or new orders, production, employment, purchases, prices paid for major purchases, lead times from sellers, purchased materials inventory (raw materials and supplies), and finished goods inventories. The respondents to the survey report the direction of each these activities as either up, the same or down in comparison to the previous month. An index for each of these areas is then calculated by subtracting the percentage of respondents that sight a negative shift from the percentage that sight a positive shift. For indicators that are positively correlated with economic growth, this results in an underlying index that points to expansion when it is above zero. Indicators that are negatively correlated with growth point to expansion when they are below zero.
The final Houston PMI is calculated by applying optimal regression factors to each of the eight underlying indicators noted above. These regression factors are determined using standard regression techniques comparing these underlying indicators to the Houston-The Woodlands-Sugar Land Business Cycle Index (Houston BCI), which is reported on a monthly basis by the Federal Reserve Bank of Dallas. This top-level index is converted to a 0 to 100 scale to match that of the national Purchasing Managers Index® (PMI®) which is published monthly by the Institute for Supply Management® (ISM®). Readings over 50 for the HPMI generally indicate manufacturing expansion in the Houston in the near term and readings below 50 show coming manufacturing contraction.
It is important to note that the manufacturing breakeven HPMI does not equate to the breakeven point for the overall Houston economy. ISM-Houston periodically reviews the capability of its correlations and adjusts the regression factors when appropriate. The most recent revision occurred as a result of a review undertaken during the third quarter of 2018, which determined that changes in the Houston economy over the last decade have shifted the intercept of the correlation, causing a neutral Houston PMI to no longer align with a neutral Houston BCI. A Houston PMI of 45 points now equates to a neutral Houston economy as measured by the Houston BCI. A similar offset between the National PMI and the National economy has existed for some time.
Use of ISM-Houston Business Report Content
All information contained in this report is protected by copyright laws and ISM-Houston retains all rights to this Content. ISM-Houston hereby grants you a limited, revocable license to access, print, and display this Content solely for your personal, non-commercial use. Requests for permission to reproduce or redistribute ISM-Houston Business Report Content can be made by contacting the ISM-Houston Business Survey Committee at hpmi@ism-houston.org.
ISM-Houston shall not have any liability, duty, or obligation for or relating to the ISM-Houston Business Report Content or other information contained herein, any errors, inaccuracies, omissions or delays in providing any ISM-Houston Business Report Content, or for any actions taken in reliance thereon. In no event shall ISM-Houston be liable for any special, incidental, or consequential damages, arising out of the use of the ISM-Houston Business Report.