
For release March 10, 2023
February 2023 ISM-Houston Business Report
Houston PMI at 52.7 (up 1.9 points)
Sales/New Orders Expanding
Production Expanding
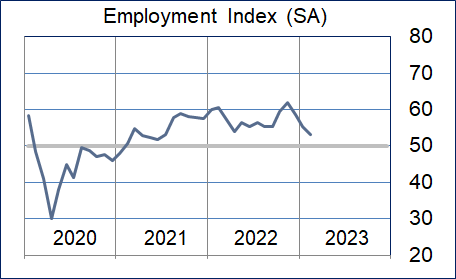
Employment Expanding
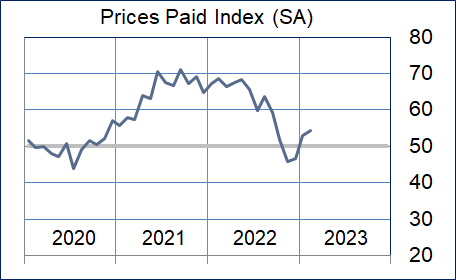
Prices Paid Expanding
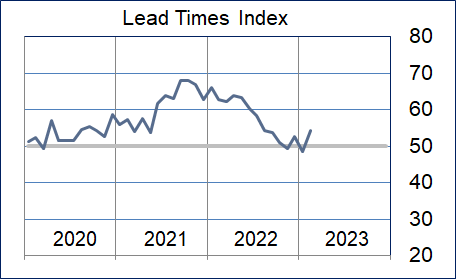
Lead Times Expanding
Finished Goods Inventories Contracting
(Houston, Texas) – According to Houston area supply chain executives, economic activity in Houston expanded at a somewhat higher pace in February. Manufacturing sector activity was relatively unchanged showing minimal contraction while nonmanufacturing activity showed a higher expansion rate.
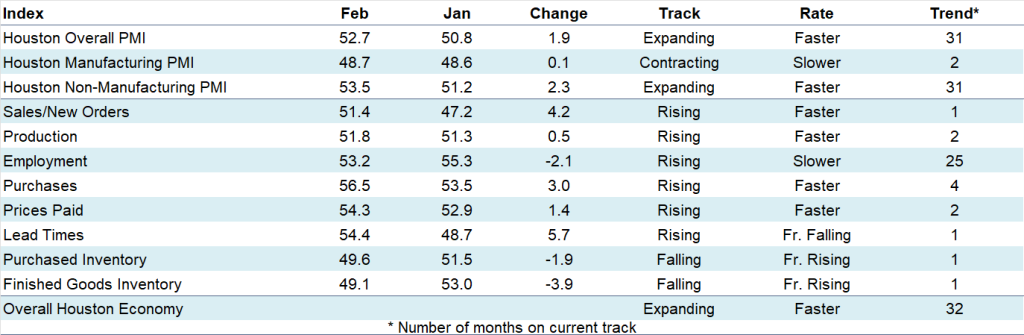
The Houston Purchasing Managers Index rose 1.9 points to 52.7. All three underlying indicators that have the strongest correlation with the Houston economy, sales/new orders, employment, and lead times, are now pointing to minimal to modest expansion. The sales/new orders index rose 4.2 points to 51.4, the employment index fell 2.1 points to 53.2, and the lead times index rose 5.7 points to 54.4. The Finished goods inventory index, the underlying indicator that has the strongest inverse correlation with economic activity, fell 3.9 points to 49.1, giving a modest signal of economic expansion.
The Houston Manufacturing PMI rose 0.1 points to 48.7, continuing to give a modest contraction signal. The nonmanufacturing PMI rose 2.3 points to 53.5, showing a higher expansion rate for the industries in this sector.
On an industry specific basis oil & gas, health care, construction, and professional and management services reported continued expansion. Trade, transportation & warehousing returned to reporting modest expansion. Manufacturing, leisure and hospitality, and real estate reported near neutral. No sector reported significant contraction.
The Houston PMI provides a measure of current economic activity in the greater Houston area and a forecast of likely shifts in activity over a three-month forecast horizon. These indicators have a possible range of 0 to 100. Readings over 50 generally indicate goods producing industry expansion; readings below 50 show contraction. A PMI above 45 generally correlates with expansion of the Houston-The Woodlands-Sugar Land Business Cycle Index. The current and forecast PMI indices are based on diffusion indices for eight underlying indicators: Sales/New Orders, Production, Employment, Purchases, Prices Paid, Lead Times, Purchase Inventory, and Finished Goods Inventory.
The Houston PMI provides a measure of current economic activity in the greater Houston area and a forecast of likely shifts in activity over a three-month forecast horizon. These indicators have a possible range of 0 to 100. Readings over 50 generally indicate goods producing industry expansion; readings below 50 show contraction. A PMI above 45 generally correlates with expansion of the Houston-The Woodlands-Sugar Land Business Cycle Index. The current and forecast PMI indices are based on diffusion indices for eight underlying indicators: Sales/New Orders, Production, Employment, Purchases, Prices Paid, Lead Times, Purchase Inventory, and Finished Goods Inventory.
Click here to see the PDF version of the full report.
Indices at a Glance
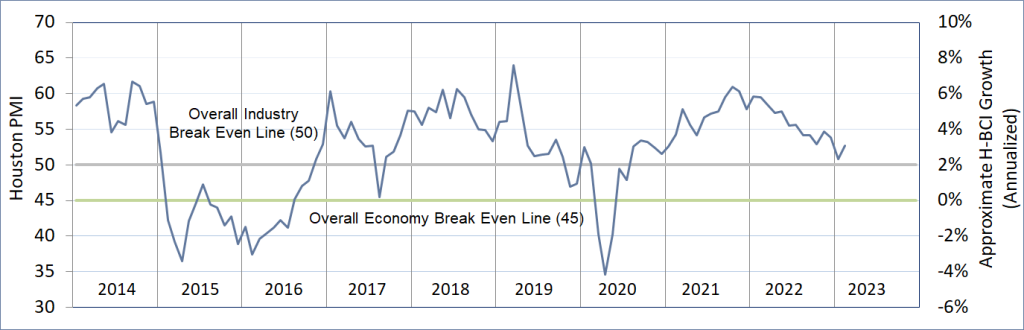
Houston PMI Trend
Houston PMI readings over 50 generally indicate that respondents see their activities as expanding. An HPMI above 45 normally correlates with expansion of the Houston-The Woodlands-Sugar Land Business Cycle Index (H-BCI).
Commodities Reported to have Notable Price Changes or to be in Short Supply
Up in Price: Professional services, technical support, oil field labor; medical and surgical supplies; natural gas‡; elastomers; electronics, electrical equipment/gear, some mechanical equipment, concrete/cement, transformers, enclosures, large cold boxes, low temp piping materials, scrap steel (no.1 busheling), hot rolled coil, road construction products; vehicles
Down in Price: Natural gas‡, diesel, jet fuel, electricity; ammonia, nitric acid, caustic soda, oil field chemicals; precious metals for catalysts (gold, silver, platinum, palladium); carbon steel, proppants
In Short Supply: Senior Consultants, oil rig labor; offshore fabrication yard capacity; medical lab supplies and test kits; uncured rubber compounds, fluoropolymers (PFAs); electronics, power supplies, automation products, electrical gear, transformers, some mechanical equipment, generators, glass, concrete/cement, construction supplies, enclosures, large cold boxes, low temp piping materials; vehicles
‡ reported as up or down by different respondents
What our Respondents are Saying
Oil and Gas Exploration, and Key Support Services:
- The service companies we contract with are challenged to attract and retain labor; we continue to see flight to other industries where working conditions are more predictable
- Rig counts fell minimally
- This sector reported continued strong growth during the month with the production, employment, prices paid, and lead times indices showing significant strength; the purchases index returned to neutral
Construction:
- The labor shortage continues to be a challenge
- Performance in this sector remained modestly above neutral during the month with the employment and prices paid indices retaining significant strength; the sales/new orders index to point to contraction
Durable Goods Manufacturing:
- This sector’s performance fell to below neutral with the sales/new orders index falling significantly below neutral; the production and purchases indices continue to point to greater expansion; the employment, prices paid, and lead times indices remained near neutral; the inventory indices improved to near neutral
Non-durable Goods Manufacturing:
- Real estate construction is still down and consumer interest in non-core products related to housing remains depressed
- This sector’s performance moved back up to near neutral driven by continued strength in the employment index and improvements in the lead times and inventory indices; the sales/new orders and production indices remaining well below neutral; all other indices came in near neutral
Trade, Transportation, and Warehousing:
- Containerized ocean freight prices from Asia appear to have bottomed out
- This sector’s performance rose modestly during the month coming in just above neutral; with nearly all indices reporting minimally above neutral
Real-Estate Services:
- New home sales remain flat; high interest rates and the overall economic uncertainty are keeping many buyers on the sideline
- This sector improved to neutral with housing at neutral; industrial and retail real estate remained strong
Leisure and Hospitality:
- This sector’s performance remained near neutral during the month with all indices reporting at this level
Professional and Business Services:
- The Houston labor market is very stable in terms of companies hiring open positions; not many openings are present and candidates are reluctant to seek new opportunities
- Even though hiring is very slow or methodical, professionals who may want to change jobs are asking for an above average compensation package compared to this time last year; this indicates that people don’t want to take chances now
- This sector’s performance improved modestly during the month with the sales/new orders, purchases, and lead times indices joining employment and prices paid indices in reporting strength
Health Care:
- We continue to experience high prices for various services; as for products, there are more alternatives in the marketplace giving the clinicians and service providers more options.
- This sector reported continue strength during the month with the employment, purchases, prices paid, and lead times indices remaining well above neutral
Trend of Underlying Indicators
The Houston PMI is based on diffusion indices for eight underlying indicators. The net value of each indicator is simply the percentage of respondents who cite a positive shift from the previous month minus the percentage who cite a negative shift. The diffusion index is calculated based on the percent of respondents reporting higher results plus one-half of those responding the same with seasonal adjustments to the Sales/New Orders, Production, Employment, and Prices Paid indices based on an X13 ARIMA forecast. Values above 50 for Sales/New Orders, Production, Employment, Prices Paid, and Lead Times generally point towards expansion and values below 50 signal contraction. Note that the Prices Paid Index may not follow this trend late in an economic expansion. The Inventory measures have an inverse correlation at most forecast horizons, meaning that values below 50 point to expansion and values above point to contraction. The Purchases index is inversely correlated with economic activity at the three-month forecast horizon.
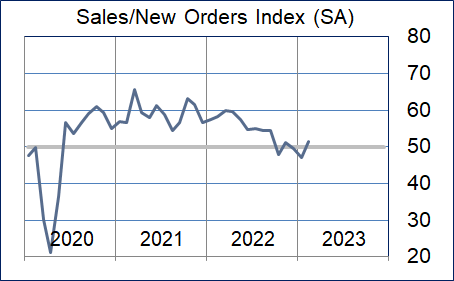
Sales/New Orders
The sales/new orders index rebounded to indicating expansion driven by improvements in the nonmanufacturing sectors. Manufacturing reported significant further contraction in this index.
| Higher | Same | Lower | Net | Index | |
| Sep/22 | 17% | 75% | 8% | 9% | 54.4 |
| Oct/22 | 6% | 81% | 13% | -7% | 47.8 |
| Nov/22 | 14% | 70% | 16% | -2% | 51.1 |
| Dec/22 | 8% | 78% | 14% | -6% | 49.5 |
| Jan/23 | 7% | 85% | 8% | -1% | 47.2 |
| Feb/23 | 10% | 85% | 5% | 5% | 51.4 |
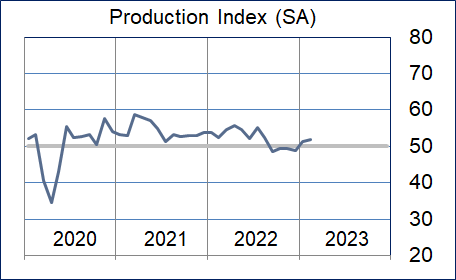
Production Index
The production index remained just above neutral. Nonmanufacturing was relatively unchanged showing continued modest expansion and manufacturing returned to indicating healthy expansion.
| Higher | Same | Lower | Net | Index | |
| Sep/22 | 6% | 85% | 9% | -3% | 48.6 |
| Oct/22 | 7% | 85% | 8% | -1% | 49.5 |
| Nov/22 | 8% | 82% | 10% | -2% | 49.3 |
| Dec/22 | 5% | 84% | 11% | -6% | 48.8 |
| Jan/23 | 9% | 84% | 7% | 2% | 51.3 |
| Feb/23 | 9% | 86% | 5% | 4% | 51.8 |
Employment Index
This index fell modestly again this month with nonmanufacturing reporting modestly slower growth. Manufacturing indicating somewhat higher expansion compared to last month.
| Sep/22 | 15% | 83% | 2% | 13% | 55.4 |
| Oct/22 | 20% | 78% | 2% | 18% | 59.3 |
| Nov/22 | 23% | 74% | 3% | 20% | 61.9 |
| Dec/22 | 16% | 81% | 3% | 13% | 58.6 |
| Jan/23 | 14% | 86% | 0% | 14% | 55.3 |
| Feb/23 | 13% | 81% | 6% | 7% | 53.2 |
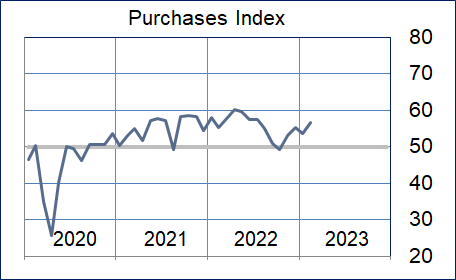
Purchases Index
The purchases index was reported as expanding at a higher rate. Nonmanufacturing activities improved to significantly above neutral while manufacturing performance showed a similar rate of modest expansion.
| Sep/22 | 11% | 84% | 5% | 6% | 51.0 |
| Oct/22 | 8% | 81% | 11% | -3% | 49.2 |
| Nov/22 | 14% | 77% | 9% | 5% | 53.0 |
| Dec/22 | 13% | 77% | 10% | 3% | 55.3 |
| Jan/23 | 10% | 87% | 3% | 7% | 53.4 |
| Feb/23 | 15% | 83% | 2% | 13% | 56.5 |
Prices Paid Index
The purchases index improved to show higher growth with nonmanufacturing showing an improved growth rate and manufacturing reporting contraction in this index.
| Higher | Same | Lower | Net | Index | |
| Sep/22 | 21% | 76% | 3% | 18% | 59.4 |
| Oct/22 | 16% | 72% | 12% | 4% | 51.9 |
| Nov/22 | 12% | 67% | 21% | -9% | 45.9 |
| Dec/22 | 7% | 76% | 17% | -10% | 46.7 |
| Jan/23 | 7% | 91% | 2% | 5% | 52.9 |
| Feb/23 | 16% | 81% | 3% | 13% | 54.3 |
Lead Times Index
This index rose significantly during the month to indicate strong expansion. Both the manufacturing and nonmanufacturing sectors reported higher lead times.
| Sep/22 | 15% | 77% | 8% | 7% | 53.8 |
| Oct/22 | 10% | 80% | 10% | 0% | 51.1 |
| Nov/22 | 9% | 80% | 11% | -2% | 49.3 |
| Dec/22 | 11% | 81% | 8% | 3% | 52.7 |
| Jan/23 | 4% | 89% | 7% | -3% | 48.7 |
| Feb/23 | 13% | 82% | 5% | 8% | 54.4 |
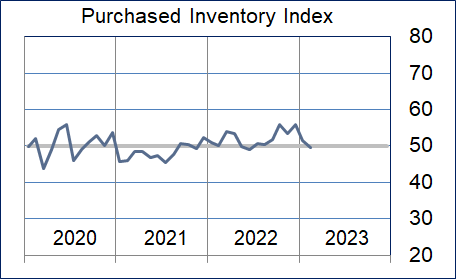
Purchased Inventory Index
The purchased inventory index fell to just below neutral with manufacturing reporting at neutral and nonmanufacturing falling to just below neutral.
| Higher | Same | Lower | Net | Index | |
| Sep/22 | 6% | 88% | 6% | 0% | 51.9 |
| Oct/22 | 8% | 88% | 4% | 4% | 55.9 |
| Nov/22 | 9% | 86% | 5% | 4% | 53.5 |
| Dec/22 | 7% | 90% | 3% | 4% | 55.9 |
| Jan/23 | 4% | 95% | 1% | 3% | 51.5 |
| Feb/23 | 6% | 88% | 6% | 0% | 49.6 |
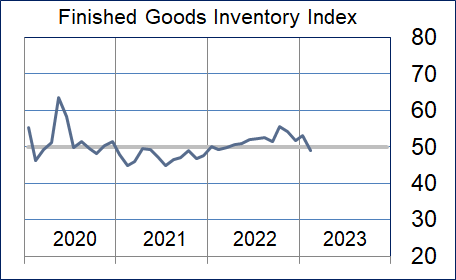
Finished Goods Inventory Index
The finished goods inventory fell below neutral with manufacturing reporting a significant drop to below neutral and nonmanufacturing finishing just below neutral.
| Higher | Same | Lower | Net | Index | |
| Sep/22 | 7% | 87% | 6% | 1% | 51.4 |
| Oct/22 | 11% | 81% | 8% | 3% | 55.7 |
| Nov/22 | 14% | 82% | 4% | 10% | 54.1 |
| Dec/22 | 10% | 85% | 5% | 5% | 51.6 |
| Jan/23 | 6% | 94% | 0% | 6% | 53.0 |
| Feb/23 | 5% | 89% | 6% | -1% | 49.1 |
Background on the ISM-Houston Business Report and HPMI Calculation Methods
The Houston Purchasing Managers Index has been included as an integral part of the ISM-Houston Business Report since the Houston chapter of the Institute for Supply Management started publication of this document in January 1995. The report and index are published monthly as the primary deliverables from a survey of Houston area Supply Chain leaders regarding the status of key activities believed to provide insight into the strength of the economy. The respondents come from diverse organizations including construction, energy, engineering, health care, durable and non-durable goods manufacturing, financial and business services, wholesale and retail trade, and utilities related companies.
The Houston Purchasing Managers Index is determined from diffusion indices of the eight indicators of economic activity covered by the ISM-Houston Business Survey and Report. These underlying indicators are sales or new orders, production, employment, purchases, prices paid for major purchases, lead times from sellers, purchased materials inventory (raw materials and supplies), and finished goods inventories. The respondents to the survey report the direction of each these activities as either up, the same or down in comparison to the previous month. An index for each of these areas is then calculated by subtracting the percentage of respondents that sight a negative shift from the percentage that sight a positive shift. For indicators that are positively correlated with economic growth, this results in an underlying index that points to expansion when it is above zero. Indicators that are negatively correlated with growth point to expansion when they are below zero.
The final Houston PMI is calculated by applying optimal regression factors to each of the eight underlying indicators noted above. These regression factors are determined using standard regression techniques comparing these underlying indicators to the Houston-The Woodlands-Sugar Land Business Cycle Index (Houston BCI), which is reported on a monthly basis by the Federal Reserve Bank of Dallas. This top-level index is converted to a 0 to 100 scale to match that of the national Purchasing Managers Index® (PMI®) which is published monthly by the Institute for Supply Management® (ISM®). Readings over 50 for the HPMI generally indicate manufacturing expansion in the Houston in the near term and readings below 50 show coming manufacturing contraction.
It is important to note that the manufacturing breakeven HPMI does not equate to the breakeven point for the overall Houston economy. ISM-Houston periodically reviews the capability of its correlations and adjusts the regression factors when appropriate. The most recent revision occurred as a result of a review undertaken during the third quarter of 2018, which determined that changes in the Houston economy over the last decade have shifted the intercept of the correlation, causing a neutral Houston PMI to no longer align with a neutral Houston BCI. A Houston PMI of 45 points now equates to a neutral Houston economy as measured by the Houston BCI. A similar offset between the National PMI and the National economy has existed for some time.
Use of ISM-Houston Business Report Content
All information contained in this report is protected by copyright laws and ISM-Houston retains all rights to this Content. ISM-Houston hereby grants you a limited, revocable license to access, print, and display this Content solely for your personal, non-commercial use. Requests for permission to reproduce or redistribute ISM-Houston Business Report Content can be made by contacting the ISM-Houston Business Survey Committee at hpmi@ism-houston.org.
ISM-Houston shall not have any liability, duty, or obligation for or relating to the ISM-Houston Business Report Content or other information contained herein, any errors, inaccuracies, omissions or delays in providing any ISM-Houston Business Report Content, or for any actions taken in reliance thereon. In no event shall ISM-Houston be liable for any special, incidental, or consequential damages, arising out of the use of the ISM-Houston Business Report.