Houston PMI at 54.0 (up 3.0 points)
Sales/New Orders Expanding
Production Expanding
Employment Expanding
Prices Paid Expanding
Lead Times Expanding
Finished Goods Inventories Expanding
Analysis and report by Ross Harvison and Murali Rajagopalachari (ISM-Houston Business Survey Committee)
(Houston, Texas) – According to Houston area supply chain executives the Houston economy expanded again in June. The manufacturing sector contracted for the first time in six months, and non-manufacturing expanded for the fifth month. The overall Houston economy expanded for the 73rd month in a row.
The Houston Purchasing Managers Index rose 3.0 points to 54.0, indicating stronger growth in the overall economy. All three of the underlying indicators that have a strong direct correlation with economic activity (sales/new orders, employment, and lead times) are pointing to modest to strong growth. The sales/new orders index rose 8.2 points to 59.4 points, the employment index rose 0.9 points to 51.8, and the lead times index rose 1.4 points to 52.7 points. The finished goods inventory index, the underlying indicator that has the strongest inverse correlation with economic activity, rose 1.1 points to 50.8, pointing to modest economic contraction.
The Houston Manufacturing PMI fell 1.5 points during the month to 48.5 points. Durable goods manufacturing continued to report significant weakness, while non-durable goods showed very modest strength. The non-manufacturing PMI rose 3.8 points to 55.0, indicating strengthening from last month.
On an industry specific basis trade/transportation/warehousing, construction, and professional services reported strong expansion. Non-durable goods reported very modest expansion. Oil and gas extraction and durable goods manufacturing continue to report weakness.
Click here for the hard copy version of this report.
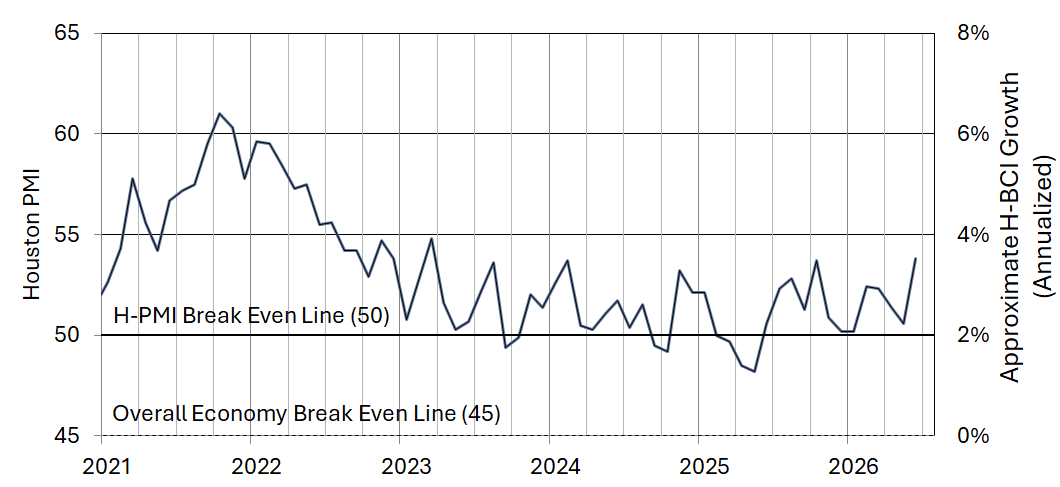
Houston PMI Trend
Indices at a Glance
Houston PMI readings over fifty indicate that respondents see their activities as expanding. An H-PMI above 45 normally correlates with expansion of the Houston-The Woodlands-Sugar Land Business Cycle Index.
| Index | Jun | May | Change | Track | Rate | Trend* |
| Houston Overall PMI | 54.0 | 51.0 | 3.0 | Expanding | Faster | 13 |
| Houston Manufacturing PMI | 48.5 | 50.0 | -1.5 | Contracting | Fr. Exp. | 1 |
| Houston Non-Manufacturing PMI | 55.0 | 51.2 | 3.8 | Expanding | Faster | 5 |
| Sales/New Orders | 59.4 | 51.2 | 8.2 | Expanding | Faster | 6 |
| Production | 52.2 | 48.9 | 3.3 | Expanding | Fr. Cont. | 1 |
| Employment | 51.8 | 50.9 | 0.9 | Expanding | Faster | 5 |
| Purchases | 55.5 | 55.1 | 0.4 | Expanding | Faster | 30 |
| Prices Paid | 61.4 | 65.1 | -3.7 | Expanding | Slower | 9 |
| Lead Times | 52.7 | 51.3 | 1.4 | Expanding | Faster | 7 |
| Purchased Inventory | 48.7 | 48.1 | 0.6 | Contracting | Slower | 4 |
| Finished Goods Inventory | 50.8 | 49.7 | 1.1 | Expanding | Fr. Cont. | 1 |
| Overall Houston Economy | Expanding | Faster | 73 | |||
| * Number of months on current track | ||||||
Commodities Reported to be Up/Down in Price or in Short Supply
Up in Price: Natural gas; oil field chemicals; ethane, petrochemicals, films, catalysts; copper‡, carbon steel; motor freight, ocean container freight.
Down in Price: Crude oil; motor fuels (gasoline, diesel, jet fuel); propane, natural gas liquids, normal butane, isobutane, natural gasoline; ethylene, propylene, resins (PVC, PE, and PP), tape; precious metals for catalysts (gold, silver, platinum, palladium, and rhodium), industrial metals (aluminum, copper‡, and nickel), dry bulk freight.
In Short Supply: Tetraethylene glycol (TEG), resins; transformers, power generation related parts/components; carbon steel.
‡ Noted as being up or down by different respondents.
What Our Respondents Are Saying:
Oil and Gas Exploration, and Key Support Services:
- Texas rig counts have risen almost 20% since the beginning of the year.
- Tariffs continue to be a concern.
- This sector reported contraction again this month. The sales and production indices moved from near neutral to showing significant expansion, while the employment, purchases, prices paid, and lead times all showed considerable weakness. The inventory indices were reported near neutral.
Construction:
- Lumber prices have remained stable for the last several months.
- Base metals were up in price but increases are expected to be minimal for finished products due to softening demand.
- The ongoing conflict in the Middle East is reshaping the global economy, driving more localized sourcing strategies rather than a uniform global approach.
- This sector continues to experience strong expansion. The sales/new orders, employment, purchases, and prices paid indices are all showing significant strength. The lead times index fell to near neutral.
Durable Goods Manufacturing:
- We are seeing longer than normal lead times on certain Weco Hammer Union components.
- Incoming orders for domestic customers have improved.
- International sales have been slower largely due to the conflict in the Middle East.
- This sector showed weakness again this month. The sales/new orders, production, employment, purchases, and lead times indices are all pointing to contraction. Only the prices paid index showed strength.
Non-durable Goods Manufacturing:
- We see our markets remaining relatively stable for the next few months.
- We had an uptick in canceled orders this month.
- Except for ethane, cracker feedstock prices fell in May.
- This sector showed limited strength this month. While the sales/new orders, production, prices paid indices pointed to strength, the employment index showed considerable weakness. All other indices were at or just below neutral.
Trade, Transportation, and Warehousing:
- Geopolitical and nature related events are taking a toll on costs.
- The second quarter was notably better than first quarter from a sales perspective.
- Ocean container freight costs have risen significantly over the last several months.
- Houston air passenger traffic rose in May consistent with normal seasonal trends.
- This sector was reported as expanding at strong pace this month with sales/new orders, employment, purchases, and prices paid indices registering as expanding at a rapid pace. All other indices were reported near neutral.
Professional and Business Services:
- Companies in the Houston area remain cautious about hiring additional staff.
- Highly specialized technical staff are scarce.
- Prices remain very steady on the hiring front whether for permanent placement or Contractors.
- Very steady market in terms of what companies are willing to pay people.
- With the price of oil now seemingly stabilized around $75/bbl, the anxiety seems to be diminishing.
- This sector reported strong expansion with the sales/new orders and employment indices showing strength. All other indices reported at or just below neutral.
Trend of Underlying Indicators
Sales/New Order Index
The sales/new orders index jumped well above neutral during the month, rising 8.2 points to 59.4 points. Both non-manufacturing and manufacturing reported expansion in this index during June.
| Sales/New Orders | Higher | Same | Lower | Net | Index |
| Jan 2026 | 18% | 72% | 10% | 8% | 52.5 |
| Feb 2026 | 22% | 75% | 3% | 19% | 56.6 |
| Mar 2026 | 19% | 74% | 7% | 12% | 54.0 |
| Apr 2026 | 17% | 78% | 5% | 12% | 53.5 |
| May 2026 | 11% | 84% | 5% | 6% | 50.3 |
| Jun 2026 | 23% | 72% | 5% | 18% | 59.4 |
Production Index
The production index rose back above neutral, ending at 52.2 points, up 3.3 points from last month. Non-manufacturing came in above neutral while manufacturing reported just below neutral.
| Production | Higher | Same | Lower | Net | Index |
| Jan 2026 | 9% | 89% | 2% | 7% | 52.4 |
| Feb 2026 | 6% | 92% | 2% | 4% | 51.0 |
| Mar 2026 | 4% | 89% | 7% | -3% | 47.4 |
| Apr 2026 | 5% | 93% | 2% | 3% | 50.4 |
| May 2026 | 5% | 90% | 5% | 0% | 48.9 |
| Jun 2026 | 8% | 87% | 5% | 3% | 52.2 |
Employment Index
The employment index rose 0.9 points to 51.4, indicating continued minimal expansion for the fifth month. While non-manufacturing remained just above neutral, manufacturing continues to report well below this level.
| Employment | Higher | Same | Lower | Net | Index |
| Jan 2026 | 6% | 84% | 10% | -4% | 46.7 |
| Feb 2026 | 10% | 84% | 6% | 4% | 50.9 |
| Mar 2026 | 6% | 90% | 4% | 2% | 51.0 |
| Apr 2026 | 8% | 88% | 4% | 4% | 50.7 |
| May 2026 | 8% | 86% | 6% | 2% | 50.5 |
| Jun 2026 | 13% | 79% | 8% | 5% | 51.4 |
Purchases Index
The purchases index rose 0.4 points to 55.5 points with non-manufacturing reporting modest improvement and manufacturing falling to well below neutral.
| Purchases | Higher | Same | Lower | Net | Index |
| Jan 2026 | 19% | 73% | 8% | 11% | 53.3 |
| Feb 2026 | 21% | 77% | 2% | 19% | 57.9 |
| Mar 2026 | 17% | 77% | 6% | 11% | 54.1 |
| Apr 2026 | 19% | 75% | 6% | 13% | 53.8 |
| May 2026 | 20% | 74% | 6% | 14% | 55.1 |
| Jun 2026 | 18% | 75% | 7% | 11% | 55.5 |
Prices Paid Index
The purchases index fell 3.7 points to 61.4 points with both non-manufacturing and manufacturing continuing to report strong expansion.
| Prices Paid | Higher | Same | Lower | Net | Index |
| Jan 2026 | 25% | 72% | 3% | 22% | 60.3 |
| Feb 2026 | 23% | 74% | 3% | 20% | 58.1 |
| Mar 2026 | 25% | 73% | 2% | 23% | 59.5 |
| Apr 2026 | 34% | 64% | 2% | 32% | 64.3 |
| May 2026 | 35% | 63% | 2% | 33% | 65.1 |
| Jun 2026 | 23% | 74% | 3% | 20% | 61.4 |
Lead Times Index
The purchases index rose 1.4 points to 52.7 points with manufacturing reporting continued strong expansion in this index and non-manufacturing remaining near neutral.
| Lead Times | Higher | Same | Lower | Net | Index |
| Jan 2026 | 8% | 88% | 4% | 4% | 54.5 |
| Feb 2026 | 7% | 89% | 4% | 3% | 50.1 |
| Mar 2026 | 17% | 79% | 4% | 13% | 54.0 |
| Apr 2026 | 7% | 91% | 2% | 5% | 51.0 |
| May 2026 | 9% | 86% | 5% | 4% | 51.3 |
| Jun 2026 | 8% | 89% | 3% | 5% | 52.7 |
Purchased Inventory Index
The purchased inventory index rose 0.5 points to 48.7 with both non-manufacturing and manufacturing reporting near this level.
| Purchased Inventory | Higher | Same | Lower | Net | Index |
| Jan 2026 | 5% | 91% | 4% | 1% | 48.9 |
| Feb 2026 | 6% | 91% | 3% | 3% | 53.6 |
| Mar 2026 | 5% | 90% | 5% | 0% | 48.3 |
| Apr 2026 | 4% | 90% | 6% | -2% | 49.2 |
| May 2026 | 3% | 93% | 4% | -1% | 48.1 |
| Jun 2026 | 3% | 92% | 5% | -2% | 48.7 |
Finished Goods Inventory Index
The finished goods inventory index returned to above neutral, rising 1.1 points to 50.8. Manufacturing reported modestly above this level while non-manufacturing remained near neutral.
| Finished Goods Inventories | Higher | Same | Lower | Net | Index |
| Jan 2026 | 6% | 91% | 3% | 3% | 51.2 |
| Feb 2026 | 4% | 91% | 5% | -1% | 49.7 |
| Mar 2026 | 6% | 89% | 5% | 1% | 50.7 |
| Apr 2026 | 8% | 86% | 6% | 2% | 51.3 |
| May 2026 | 5% | 90% | 5% | 0% | 49.7 |
| Jun 2026 | 7% | 88% | 5% | 2% | 50.8 |
Houston PMI Calculation Methods
The Houston Purchasing Managers Index has been included as an integral part of the ISM-Houston Business Report since the Houston affiliate of the Institute for Supply Management started publishing this document in January 1995. The report and index are issued monthly as the primary deliverables from a survey of Houston area Supply Chain leaders regarding the status of key activities that provide insight into the strength of the economy. The respondents come from diverse organizations including construction, energy, engineering, health care, durable and non-durable goods manufacturing, financial and business services, wholesale and retail trade, and utilities related companies.
The Houston Purchasing Managers Index is determined from diffusion indices of the eight indicators of economic activity covered by the ISM-Houston Business Survey and Report. These underlying indicators are sales or new orders, production, employment, purchases, prices paid for major purchases, lead times from sellers, purchased materials inventory (raw materials and supplies), and finished goods inventories. The respondents to the survey report the direction of each of these activities as either up, the same, or down in comparison to the previous month. An index for each of these areas is then calculated by subtracting the percentage of respondents that sight a negative shift from the percentage that sight a positive shift. For indicators that are positively correlated with economic growth, this results in an underlying index that points to expansion when it is above zero. Indicators that are negatively correlated with growth point to expansion when they are below zero.
The final Houston PMI is calculated by applying optimal regression factors to each of the eight underlying indicators noted above. These regression factors are determined using standard regression techniques comparing these underlying indicators to the Houston-The Woodlands-Sugar Land Business Cycle Index (Houston BCI), which is reported monthly by the Federal Reserve Bank of Dallas. This top-level index is converted to a 0 to 100 scale to match that of the national Purchasing Managers Index® (PMI®) which is published monthly by the Institute for Supply Management® (ISM®). Readings over 50 for the HPMI generally indicate manufacturing expansion in Houston in the near term and readings below 50 show coming manufacturing contraction.
It is important to note that the manufacturing breakeven HPMI does not equate to the breakeven point for the overall Houston economy. ISM-Houston periodically reviews the capability of its correlations and adjusts the regression factors when appropriate. The most recent revision occurred in 2018 after it was determined that changes in the Houston economy over the previous decade had shifted the intercept of the correlation, causing a neutral Houston PMI to no longer align with a neutral Houston BCI. A Houston PMI of 45 points now equates to a neutral Houston economy as measured by the Houston BCI. A similar offset between the National PMI and the National economy has existed for some time.
Use of ISM-Houston Business Report Content
All information included in this report is protected under copyright law, and ISM-Houston reserves all rights to this content. ISM-Houston grants a limited, revocable license for personal, non-commercial use, including access, printing, and display of content. Requests for permission to reproduce or redistribute the ISM-Houston Business Report content should be directed to the ISM-Houston Business Survey Committee at hpmi@ism-houston.org.
ISM-Houston assumes no liability, obligation, or responsibility for the accuracy, completeness, or timeliness of the information contained herein. This includes any errors, omissions, or delays in providing the report. Furthermore, ISM-Houston shall not be liable for any damages, whether direct, incidental, consequential, or special, arising from the use or reliance on the information provided in this report.
ISM-Houston Business Report Background
The ISM-Houston Purchasing Manager Report has provided some of the best information regarding what is happening in the Greater Houston area economy for over 30 years. It delivers significant analytical data along with a summary of what Houston area Supply Chain Leaders are saying about the economy and is subscribed to by a wide range of global business leaders, economists, researchers, and reporters.
The report and index are published monthly as the primary deliverables from a survey of Houston area Supply Chain professionals. These highly engaged leaders provide information on key activities that are related to the strength of the economy. They come from diverse organizations including construction, energy, engineering, health care, durable and non-durable goods manufacturing, financial and business services, wholesale and retail trade, and utilities related companies.
We are always looking to improve our coverage of the industries that make up our economy. Please join us to help make our results even more representative of what’s happening in Houston by completing this signup form.