
For release January 10, 2023
December ISM-Houston Business Report
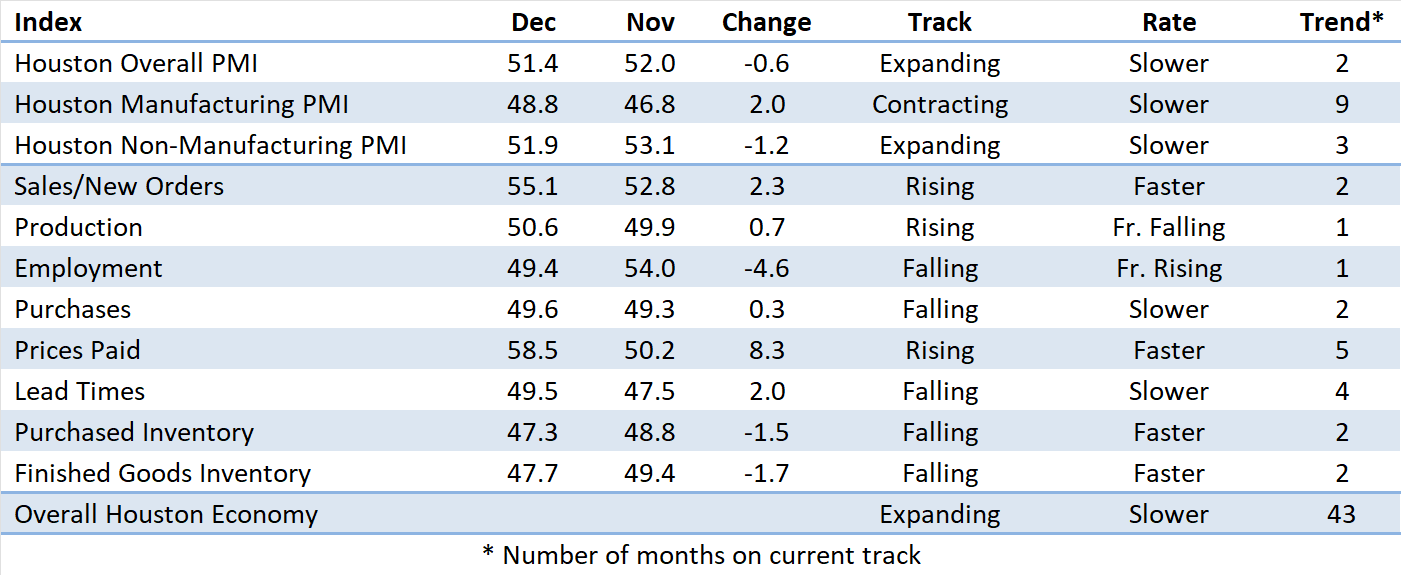
Houston PMI at 51.4 (down 0.6 points)
Sales/New Orders Expanding
Production Expanding
Employment Contracting
Prices Paid Expanding
Lead Times Contracting
Finished Goods Inventories Contracting
(Houston, Texas) – According to Houston area supply chain executives, economic activity in Houston continued to expand in December with continued mixed results by sector. The nonmanufacturing sectors expanding at a faster pace and the manufacturing sectors continuing to report weakness.
The Houston Purchasing Managers Index fell 0.6 points to 51.4. Only one of the three indicators with a strong positive correlation with the Houston economy, sales/new orders, is now pointing to expansion. The other two, employment and lead times, are indicating potential contraction. The sales/new orders index rose 2.9 points to 55.7. The employment index fell 4.6 points to 49.4 ending a 34-month trend of expanding. The lead times index rose 2.0 points to 49.5 giving a very modest signal for contraction. The finished goods inventory index, the underlying indicator that has the strongest inverse correlation with economic activity, fell 1.7 points to 47.7 giving a stronger signal of potential overall economic expansion.
The Houston Manufacturing PMI rose 2.0 points to 48.8, providing a moderately lower signal for contraction in this sector. The nonmanufacturing PMI fell 1.2 points to 51.9, showing a slowing indication of expansion for the industries in this sector.
On an industry specific basis construction and oil & gas reported strong expansion, and professional and management services reported modest expansion. Health care and manufacturing reported weakness.
Click here to see the PDF version of the full report.
Indices at a Glance
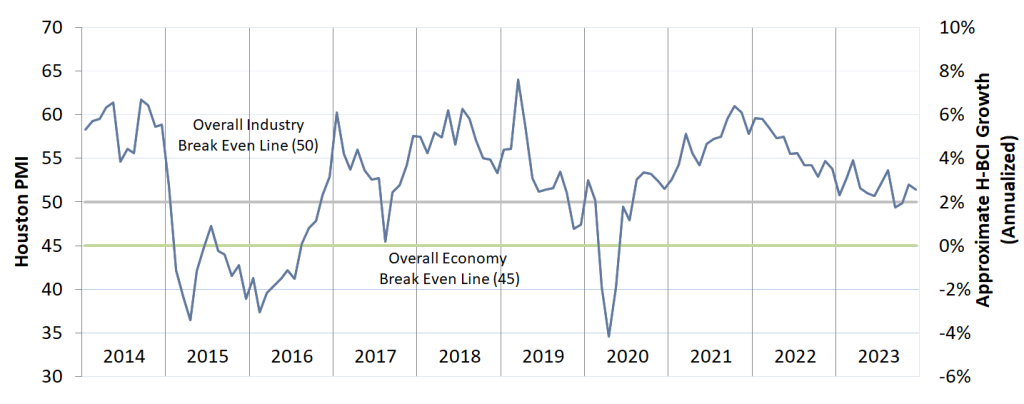
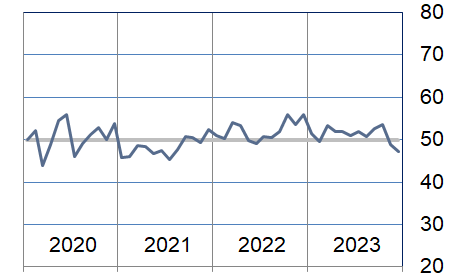
Houston PMI Trend
Houston PMI readings over 50 generally indicate that respondents see their activities as expanding. An HPMI above 45 normally correlates with expansion of the Houston-The Woodlands-Sugar Land Business Cycle Index (H-BCI).
Commodities Reported to have Notable Price Changes or to be in Short Supply
Up in Price: General labor, craft labor, rig Labor, oil field frac services; normal butane, propane, some low-density polyethylene grades, elastomers, specialty chemicals, glycols, platinum, palladium; electrical gear, instrumentation, transformers, electronics; software; breakbulk cargo and container ocean freight.
Down in Price: Crude oil, diesel, jet fuel; ethane, ethylene, industrial gases (hydrogen, nitrogen, oxygen); fabricated equipment, carbon steel, oil country tubular goods (OCTG), cobalt, titanium, molybdenum; drums, totes, land freight.
In Short Supply: Specialty labor, rig labor, craft labor, power suppliers, compressors, fluoropolymers (PFAs), generators, transformers, electrical steel, instrumentation electronics, some electrical and automation equipment, specialty marine vessels.
‡ reported as up or down by different respondents
What our Respondents are Saying
Oil and Gas Exploration, and Key Support Services:
- Inflationary headwinds are moderating, flat pricing expectations for 1H-2024. Labor costs, retention and quality of labor remain a headwind.
- While U.S. and Texas rig counts are stable, crude production continues to rise.
- This sector continues showing modest expansion; the production, sales/new orders, purchases and prices paid indices moved to well above neutral. The employment index fell to near neutral. Lead times continued to fall.
Construction:
- Individual construction sectors are still seeing variability, but overall demand is still strong.
- The shipping disruptions in the Red Sea are increasing delivery times for ocean cargo, and freight costs have increased significantly.
- This sector continues to show modest to strong growth; the employment and purchases indices continue to show strength; new orders saw modest growth. The prices paid index move from strong expansion to contraction.
Durable Goods Manufacturing:
- This sector continues to report contraction at a significant rate; all indices, other than prices paid and lead times, were reported as contracting at a fast pace; the prices paid and lead times indices were near neutral.
Non-durable Goods Manufacturing:
- Most commodity prices reached their floor in the third quarter of 2023. Prices increased in Q423, however, we expect declines during the first half 2024.
- The market outlook for the next 12 months mostly suggests deflation or moderate upward trends.
- This sector’s performance improved to just above neutral driven by strengthening of the employment and prices paid indices; the sales/new orders, production, purchases and inventory indices continue to show weakness.
Trade, Transportation, and Warehousing:
- Year to date Houston air passenger totals right at 2019 levels for the first time
- This sector’s performance showed expansion at a faster pace in December, primarily driven by strengthening of the sales/new orders, employment, and prices paid indices.
Professional and Business Services:
- In the people business, it continues to be a very flat market. Not many companies adding to staff and not many people looking for a “change in Venue.”
- Prices holding steady for both those companies looking to hire and those people looking for either employment or a change of venue.
- This sector reported expansion at a much slower rate this month; an improved sales/new orders index was more than offset by significant contraction in the employment index.
Health Care:
- Recently receiving requests for price increases. Lots of negotiating on redoing contracts, committing to longer terms. Most commodities/suppliers are trying to raise cost. Especially on Contract labor.
- Times are tough in healthcare as we are near concluding the first year of the Medicare advantage reimbursement cuts. The first of 3 years of cuts by 10%. Things will continue to be tight and hiring for non-medical revenue generating staff is frozen.
- Diversity of business is key; growth for 2024 will slow down because of it.
- This sector reported contraction during the month with a sharp decline in the employment index. The prices paid index saw significant strength with all other indices remaining near neutral.
Trend of Underlying Indicators
The Houston PMI is based on diffusion indices for eight underlying indicators. The net value of each indicator is simply the percentage of respondents who cite a positive shift from the previous month minus the percentage who cite a negative shift. The diffusion index is calculated based on the percent of respondents reporting higher results plus one-half of those responding the same with seasonal adjustments to the Sales/New Orders, Production, Employment, and Prices Paid indices based on an X13 ARIMA forecast. Values above 50 for Sales/New Orders, Production, Employment, Prices Paid, and Lead Times generally point towards expansion and values below 50 signal contraction. Note that the Prices Paid Index may not follow this trend late in an economic expansion. The Inventory measures have an inverse correlation at most forecast horizons, meaning that values below 50 point to expansion and values above point to contraction. The Purchases index is inversely correlated with economic activity at the three-month forecast horizon.
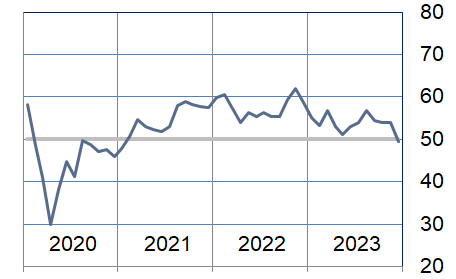
Sales/New Orders (Seasonally Adjusted)
The sales/new orders index expanded at a faster rate. Nonmanufacturing activity remained strong while manufacturing activity continued to contract, but at a much slower rate.
| Higher | Same | Lower | Net | Index | |
| Jul/23 | 13% | 75% | 12% | 1% | 51.2 |
| Aug/23 | 16% | 78% | 6% | 10% | 54.0 |
| Sep/23 | 8% | 76% | 16% | -8% | 44.6 |
| Oct/23 | 5% | 79% | 16% | -11% | 46.6 |
| Nov/23 | 8% | 84% | 8% | 0% | 52.8 |
| Dec/23 | 7% | 87% | 6% | 1% | 55.1 |
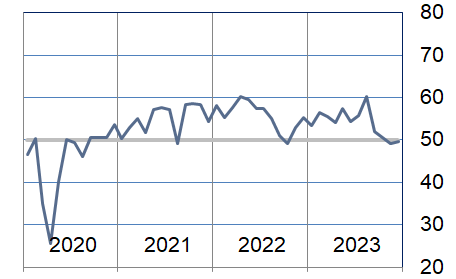
Production Index (Seasonally Adjusted)
The production index rose to show minimal expansion. Nonmanufacturing sectors continued to expand at a moderate rate while manufacturing sectors reported significant contraction in this index again this month.
| Higher | Same | Lower | Net | Index | |
| Jul/23 | 17% | 74% | 9% | 8% | 53.9 |
| Aug/23 | 12% | 85% | 3% | 9% | 54.5 |
| Sep/23 | 11% | 84% | 5% | 6% | 53.3 |
| Oct/23 | 8% | 87% | 5% | 3% | 52.0 |
| Nov/23 | 5% | 88% | 7% | -2% | 49.9 |
| Dec/23 | 8% | 84% | 8% | 0% | 50.6 |
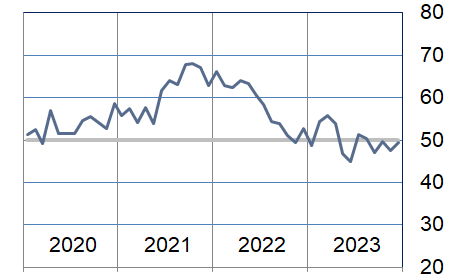
Employment Index (Seasonally Adjusted)
The employment index moved to indicating minimal contraction with both the manufacturing and nonmanufacturing sectors at this level.
| Higher | Same | Lower | Net | Index | |
| Jul/23 | 14% | 82% | 4% | 10% | 54.0 |
| Aug/23 | 13% | 82% | 5% | 8% | 56.8 |
| Sep/23 | 14% | 80% | 6% | 8% | 54.4 |
| Oct/23 | 7% | 91% | 2% | 5% | 53.9 |
| Nov/23 | 5% | 92% | 3% | 2% | 54.0 |
| Dec/23 | 4% | 89% | 7% | -3% | 49.4 |
Purchases Index (Not Seasonally Adjusted)
The purchases index remained just below neutral this month. Manufacturing sectors continued to report significant contraction in this index while the nonmanufacturing sectors remained modestly above neutral.
| Higher | Same | Lower | Net | Index | |
| Jul/23 | 19% | 73% | 8% | 11% | 55.7 |
| Aug/23 | 27% | 67% | 6% | 21% | 60.2 |
| Sep/23 | 21% | 62% | 17% | 4% | 51.9 |
| Oct/23 | 16% | 69% | 15% | 1% | 50.6 |
| Nov/23 | 7% | 84% | 9% | -2% | 49.3 |
| Dec/23 | 8% | 83% | 9% | -1% | 49.6 |
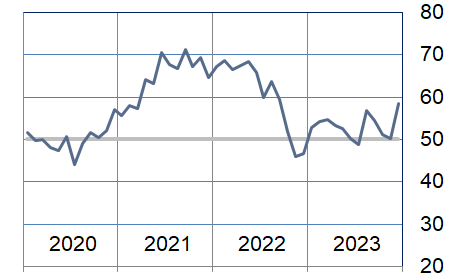
Prices Paid Index (Seasonally Adjusted)
The prices paid index moved to indicating expansion at a strong pace. Nonmanufacturing expanded at a much faster pace while manufacturing moved from indicating contraction to pointing to modest expansion.
| Higher | Same | Lower | Net | Index | |
| Jul/23 | 8% | 82% | 10% | -2% | 48.9 |
| Aug/23 | 17% | 78% | 5% | 12% | 56.9 |
| Sep/23 | 12% | 85% | 3% | 9% | 54.4 |
| Oct/23 | 8% | 90% | 2% | 6% | 51.1 |
| Nov/23 | 3% | 92% | 5% | -2% | 50.2 |
| Dec/23 | 14% | 84% | 2% | 12% | 58.5 |
Lead Times Index (Not Seasonally Adjusted)
The lead times index rose to just below neutral with both manufacturing and nonmanufacturing sectors reporting at this level.
| Higher | Same | Lower | Net | Index | |
| Jul/23 | 12% | 79% | 9% | 3% | 51.4 |
| Aug/23 | 9% | 83% | 8% | 1% | 50.5 |
| Sep/23 | 6% | 82% | 12% | -6% | 47.1 |
| Oct/23 | 6% | 87% | 7% | -1% | 49.5 |
| Nov/23 | 4% | 87% | 9% | -5% | 47.5 |
| Dec/23 | 3% | 93% | 4% | -1% | 49.5 |
Purchased Inventory Index (Not Seasonally Adjusted)
The purchased inventory index fell further below neutral during the month, led by more weaking in the manufacturing sectors. Nonmanufacturing performance was near neutral.
| Higher | Same | Lower | Net | Index | |
| Jul/23 | 8% | 88% | 4% | 4% | 52.0 |
| Aug/23 | 6% | 89% | 5% | 1% | 50.8 |
| Sep/23 | 10% | 85% | 5% | 5% | 52.5 |
| Oct/23 | 8% | 91% | 1% | 7% | 53.4 |
| Nov/23 | 3% | 91% | 6% | -3% | 48.8 |
| Dec/23 | 2% | 91% | 7% | -5% | 47.3 |
Finished Goods Inventory Index (Not Seasonally Adjusted)
The finished goods inventory index also contracted at a faster pace as a result of the manufacturing sector reporting month over month lower finished goods inventory.
| Higher | Same | Lower | Net | Index | |
| Jul/23 | 9% | 86% | 5% | 4% | 52.1 |
| Aug/23 | 12% | 85% | 3% | 9% | 54.7 |
| Sep/23 | 9% | 86% | 5% | 4% | 51.9 |
| Oct/23 | 13% | 86% | 1% | 12% | 56.1 |
| Nov/23 | 5% | 89% | 6% | -1% | 49.4 |
| Dec/23 | 4% | 88% | 8% | -4% | 47.7 |
Background on the ISM-Houston Business Report and HPMI Calculation Methods
The Houston Purchasing Managers Index has been included as an integral part of the ISM-Houston Business Report since the Houston chapter of the Institute for Supply Management started publication of this document in January 1995. The report and index are published monthly as the primary deliverables from a survey of Houston area Supply Chain leaders regarding the status of key activities believed to provide insight into the strength of the economy. The respondents come from diverse organizations including construction, energy, engineering, health care, durable and non-durable goods manufacturing, financial and business services, wholesale and retail trade, and utilities related companies.
The Houston Purchasing Managers Index is determined from diffusion indices of the eight indicators of economic activity covered by the ISM-Houston Business Survey and Report. These underlying indicators are sales or new orders, production, employment, purchases, prices paid for major purchases, lead times from sellers, purchased materials inventory (raw materials and supplies), and finished goods inventories. The respondents to the survey report the direction of each these activities as either up, the same or down in comparison to the previous month. An index for each of these areas is then calculated by subtracting the percentage of respondents that sight a negative shift from the percentage that sight a positive shift. For indicators that are positively correlated with economic growth, this results in an underlying index that points to expansion when it is above zero. Indicators that are negatively correlated with growth point to expansion when they are below zero.
The final Houston PMI is calculated by applying optimal regression factors to each of the eight underlying indicators noted above. These regression factors are determined using standard regression techniques comparing these underlying indicators to the Houston-The Woodlands-Sugar Land Business Cycle Index (Houston BCI), which is reported on a monthly basis by the Federal Reserve Bank of Dallas. This top-level index is converted to a 0 to 100 scale to match that of the national Purchasing Managers Index® (PMI®) which is published monthly by the Institute for Supply Management® (ISM®). Readings over 50 for the HPMI generally indicate manufacturing expansion in the Houston in the near term and readings below 50 show coming manufacturing contraction.
It is important to note that the manufacturing breakeven HPMI does not equate to the breakeven point for the overall Houston economy. ISM-Houston periodically reviews the capability of its correlations and adjusts the regression factors when appropriate. The most recent revision occurred as a result of a review undertaken during the third quarter of 2018, which determined that changes in the Houston economy over the last decade have shifted the intercept of the correlation, causing a neutral Houston PMI to no longer align with a neutral Houston BCI. A Houston PMI of 45 points now equates to a neutral Houston economy as measured by the Houston BCI. A similar offset between the National PMI and the National economy has existed for some time.
Use of ISM-Houston Business Report Content
All information contained in this report is protected by copyright laws and ISM-Houston retains all rights to this Content. ISM-Houston hereby grants you a limited, revocable license to access, print, and display this Content solely for your personal, non-commercial use. Requests for permission to reproduce or redistribute ISM-Houston Business Report Content can be made by contacting the ISM-Houston Business Survey Committee at hpmi@ism-houston.org.
ISM-Houston shall not have any liability, duty, or obligation for or relating to the ISM-Houston Business Report Content or other information contained herein, any errors, inaccuracies, omissions or delays in providing any ISM-Houston Business Report Content, or for any actions taken in reliance thereon. In no event shall ISM-Houston be liable for any special, incidental, or consequential damages, arising out of the use of the ISM-Houston Business Report.