
For release January 10, 2023
December 2022 ISM-Houston Business Report
Houston PMI at 54.7 (up 1.8 points)
Sales/New Orders Contracting
Production Contracting
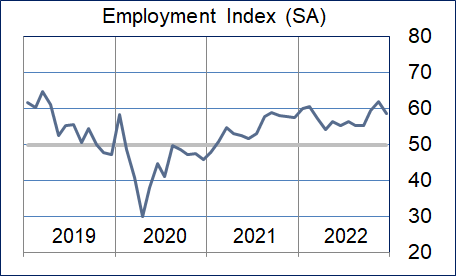
Employment Expanding
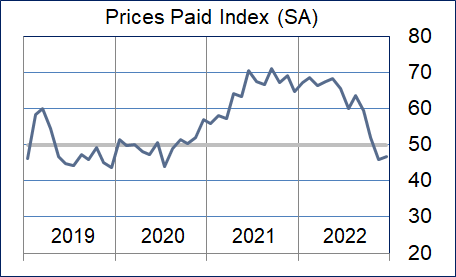
Prices Paid Contracting
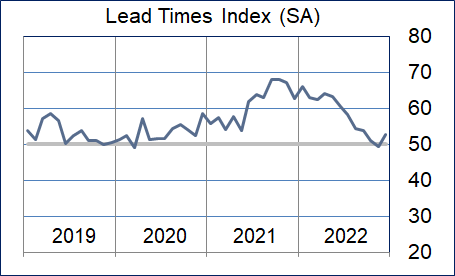
Lead Times Expanding
Finished Goods Inventories Expanding
(Houston, Texas) – According to Houston area supply chain executives, economic activity in Houston expanded at a somewhat slower pace in December. Manufacturing sector activity came in at neutral month over month while nonmanufacturing activity showed modestly lower expansion.
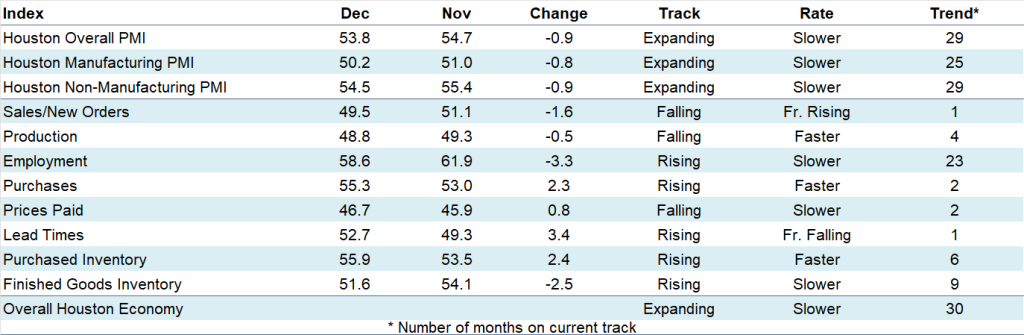
The Houston Purchasing Managers Index fell 0.9 points to 53.8. Two of the three underlying indicators that have the strongest correlation with the Houston economy, sales/new orders and employment, fell indicating weaker expansion. The third, lead times, rose above neutral indicating potential expansion. The sales/new orders index fell 1.6 points to 49.5. The employment index fell 3.3 points to 58.6. The lead times index rose 3.4 points to 52.7. The Finished goods inventory index, the underlying indicator that has the strongest inverse correlation with economic activity, fell 2.5 points to 51.6, giving a lower indication of contraction.
The Houston Manufacturing PMI fell 0.8 points to 50.2, giving neither an expansion nor contraction signal. The non-manufacturing PMI fell 0.9 points to 54.5, showing a slower expansion rate for the industries in this sector.
On an industry specific basis, professional and management services, construction, oil & gas, leisure and hospitality, and health care reported continued expansion. Manufacturing and trade, transportation & warehousing reported near neutral. Real estate reported significant contraction.
The Houston PMI provides a measure of current economic activity in the greater Houston area and a forecast of likely shifts in activity over a three-month forecast horizon. These indicators have a possible range of 0 to 100. Readings over 50 generally indicate goods producing industry expansion; readings below 50 show contraction. A PMI above 45 generally correlates with expansion of the Houston-The Woodlands-Sugar Land Business Cycle Index. The current and forecast PMI indices are based on diffusion indices for eight underlying indicators: Sales/New Orders, Production, Employment, Purchases, Prices Paid, Lead Times, Purchase Inventory, and Finished Goods Inventory.
The Houston PMI provides a measure of current economic activity in the greater Houston area and a forecast of likely shifts in activity over a three-month forecast horizon. These indicators have a possible range of 0 to 100. Readings over 50 generally indicate goods producing industry expansion; readings below 50 show contraction. A PMI above 45 generally correlates with expansion of the Houston-The Woodlands-Sugar Land Business Cycle Index. The current and forecast PMI indices are based on diffusion indices for eight underlying indicators: Sales/New Orders, Production, Employment, Purchases, Prices Paid, Lead Times, Purchase Inventory, and Finished Goods Inventory.
Click here to see the PDF version of the full report.
Indices at a Glance
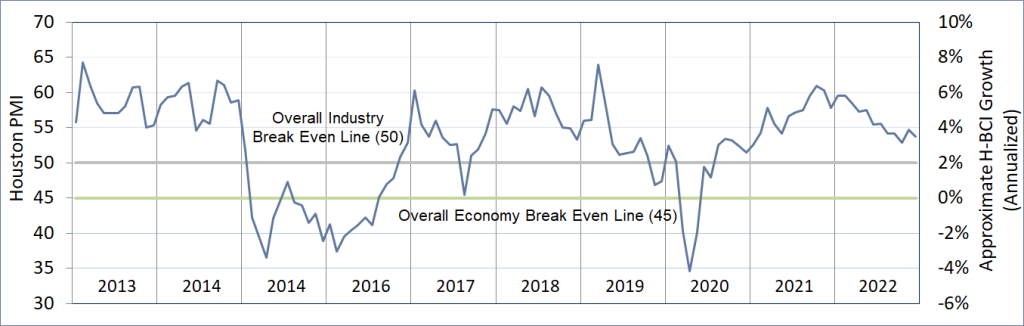
Houston PMI Trend
Houston PMI readings over 50 generally indicate that respondents see their activities as expanding. An HPMI above 45 normally correlates with expansion of the Houston-The Woodlands-Sugar Land Business Cycle Index (H-BCI).
Commodities Reported to have Notable Price Changes or to be in Short Supply
Up in Price: Contract professional services, temporary and general labor; oil country tubular goods, frac sand, pumping services, rigs, oil field chemicals; precious metals for catalysts (gold, silver, platinum), nickel; liquid and solid caustic soda, elastomers; electronics, electrical equipment/gear/components, some mechanical equipment, roofing, insulation, carbon steel‡, steel round bar; truck transportation
Down in Price: Crude oil, motor fuels (gasoline, diesel, jet fuel); natural gas, natural gas liquids, ethane, propane, butane, isobutane, ethylene, ethylene dichloride (EDC), ammonia; carbon steel‡, stainless steel products, copper wire and cable, aluminum products, lumber, computer hardware; palladium, rhodium, magnesium, titanium; containerized and bulk ocean freight
In Short Supply: Temporary labor and senior consultants; testing kits (flu, strep and RSV), lab supplies; oil country tubular goods; caustic, fluoropolymers (PFAs), hydrogenated nitrile rubber products, compressed natural gas; electrical components, electronics, electrical gear, variable frequency drives, generators, some mechanical equipment, cement/concrete, carbon steel; semiconductors
‡ reported as up or down by different respondents
What our Respondents are Saying
Oil and Gas Exploration, and Key Support Services:
- Leveraging existing long term supplier relationships by extending contract terms to mitigate price escalation and increase surety of supply
- Rig counts have stabilized
- This sector reported somewhat higher growth this month with the production, employment, prices paid, and lead times indices showing significant strength; the purchases index fell to near neutral
Construction:
- The shortage of labor in the US continues to be a challenge across industries
- Mixed bag for construction sectors; demand still good in many areas
- Performance in this sector remained above neutral with the lead times index joining the employment and purchases indices showing strength; the sales/new index continues to point to modest contraction
Durable Goods Manufacturing:
- Being a manufacturer for the oil and gas sector, we expect for our demand to remain strong through 2023
- Rising material costs and long lead times remain a challenge
- This sector showed expansion again this month with the sales/new orders and production indices pointing to strength; the employment, purchases, prices paid, and lead times indices returned to near neutral; inventories are still too high
Non-durable Goods Manufacturing:
- Continued softening in demand in the USA
- Seeing demand contraction for basic chemicals and anticipating easing supply chain pressure in 2H-2023
- Winter storm resulted in several planned and unplanned shutdowns in chemicals and refining
- This sector remained below neutral with the lead times index joining the sales/new orders, production, purchases, and prices paid indices coming in well below neutral; the employment index remained strong
Trade, Transportation, and Warehousing:
- This sector reported expansion at a slow pace again this month; the employment index remained strong while the prices paid and lead time indices were reported below neutral; all other indices came in near neutral
Real-Estate Services:
- We continue to see significant sales contraction in the new and existing home sectors
- This sector came in well below neutral again this month with housing contracting at a rapid pace; industrial and retail real estate remained strong
Leisure and Hospitality:
- This sector reported strength during the month led by a strong sales/new orders index; all other indices came in near neutral
Professional and Business Services:
- Inflation continues to negatively impact hiring and capital spending
- Companies are anticipating a tough 2023 and are being very thoughtful and deliberate about their hiring
- Prices in the people business continue to be flat with no significant movement either up or down
- Our clients and contacts indicate that current crude oil pricing near $80/bbl is good for the energy sector
- This sector continued to expand at a high rate with the employment, purchases, and lead times indices coming in well above neutral; all other indices came in at neutral
Health Care:
- Healthcare remains strong, especially for non-acute care
- We are seeing huge growth on value based healthcare compared to fee for service
- Cost for supplies have remained high as we continue to absorb high shipping costs
- Healthcare facilities are stocking up on testing kits since these are critical for diagnosing and treating patients
- We are now prepared for a potential surge in COVID cases and other respiratory illness as we enter into the winter season; this will put a strain on clinical supplies for many healthcare facilities.
- This sector’s performance fell during the month but remained well above neutral; the purchases and lead times indices remained strong while all other indices came in near neutral
Trend of Underlying Indicators
The Houston PMI is based on diffusion indices for eight underlying indicators. The net value of each indicator is simply the percentage of respondents who cite a positive shift from the previous month minus the percentage who cite a negative shift. The diffusion index is calculated based on the percent of respondents reporting higher results plus one-half of those responding the same with a seasonal adjustment based on an X13 ARIMA forecast. Values above 50 for Sales/New Orders, Production, Employment, Prices Paid, and Lead Times generally point towards expansion and values below 50 signal contraction. Note that the Prices Paid Index may not follow this trend late in an economic expansion. The Inventory measures have an inverse correlation at most forecast horizons, meaning that values below 50 point to expansion and values above point to contraction. The Purchases index is inversely correlated with economic activity at the three-month forecast horizon.
Sales/New Orders
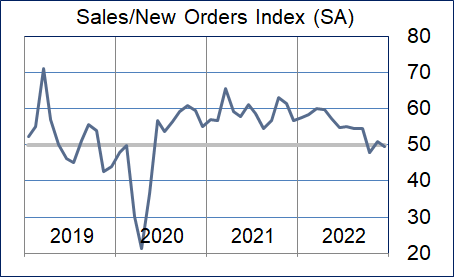
The sales/new orders index fell back below neutral with both the manufacturing and nonmanufacturing sectors coming in just below neutral.
| Higher | Same | Lower | Net | Index | |
| Jul/22 | 15% | 81% | 4% | 11% | 55.0 |
| Aug/22 | 14% | 82% | 4% | 10% | 54.6 |
| Sep/22 | 17% | 75% | 8% | 9% | 54.4 |
| Oct/22 | 6% | 81% | 13% | -7% | 47.8 |
| Nov/22 | 14% | 70% | 16% | -2% | 51.1 |
| Dec/22 | 8% | 78% | 14% | -6% | 49.5 |
Production Index
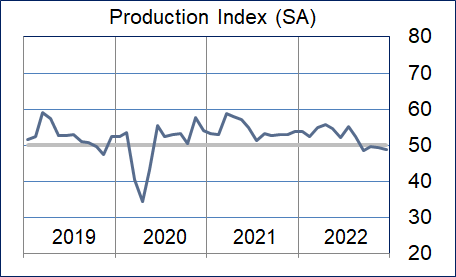
The production index fell modestly. Manufacturing came in well below neutral and nonmanufacturing reported just below neutral.
| Higher | Same | Lower | Net | Index | |
| Jul/22 | 13% | 84% | 3% | 10% | 55.1 |
| Aug/22 | 10% | 85% | 5% | 5% | 52.5 |
| Sep/22 | 6% | 85% | 9% | -3% | 48.6 |
| Oct/22 | 7% | 85% | 8% | -1% | 49.5 |
| Nov/22 | 8% | 82% | 10% | -2% | 49.3 |
| Dec/22 | 5% | 84% | 11% | -6% | 48.8 |
Employment Index
This index fell modestly with nonmanufacturing continuing to report well above neutral and manufacturing reporting at neutral . Oil & gas, construction, and professional services reported strength.
| Jul/22 | 15% | 83% | 2% | 13% | 56.3 |
| Aug/22 | 14% | 84% | 2% | 12% | 55.4 |
| Sep/22 | 15% | 83% | 2% | 13% | 55.4 |
| Oct/22 | 20% | 78% | 2% | 18% | 59.3 |
| Nov/22 | 23% | 74% | 3% | 20% | 61.9 |
| Dec/22 | 16% | 81% | 3% | 13% | 58.6 |
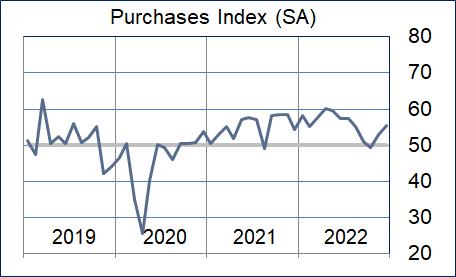
Purchases Index
The purchases index rose. Construction, professional services, and health care reported strength. Wholesale trade, nondurable goods manufacturing, and real estate reported weakness.
| Jul/22 | 17% | 79% | 4% | 13% | 57.5 |
| Aug/22 | 19% | 74% | 7% | 12% | 55.1 |
| Sep/22 | 11% | 84% | 5% | 6% | 51.0 |
| Oct/22 | 8% | 81% | 11% | -3% | 49.2 |
| Nov/22 | 14% | 77% | 9% | 5% | 53.0 |
| Dec/22 | 13% | 77% | 10% | 3% | 55.3 |
Prices Paid Index
Both nonmanufacturing and manufacturing reported this index as contracting again this month. Oil and gas and health care reported expansion. Nondurable goods, wholesale trade, and real estate reported contraction.
| Higher | Same | Lower | Net | Index | |
| Jul/22 | 24% | 69% | 7% | 17% | 60.0 |
| Aug/22 | 29% | 67% | 4% | 25% | 63.6 |
| Sep/22 | 21% | 76% | 3% | 18% | 59.4 |
| Oct/22 | 16% | 72% | 12% | 4% | 51.9 |
| Nov/22 | 12% | 67% | 21% | -9% | 45.9 |
| Dec/22 | 7% | 76% | 17% | -10% | 46.7 |
Lead Times Index
This index rose modestly. Nonmanufacturing reported this index as expanding and manufacturing reported it as contracting. The greatest strength was reported by oil & gas, construction, and health care.
| Jul/22 | 22% | 73% | 5% | 17% | 58.3 |
| Aug/22 | 17% | 76% | 7% | 10% | 54.4 |
| Sep/22 | 15% | 77% | 8% | 7% | 53.8 |
| Oct/22 | 10% | 80% | 10% | 0% | 51.1 |
| Nov/22 | 9% | 80% | 11% | -2% | 49.3 |
| Dec/22 | 11% | 81% | 8% | 3% | 52.7 |
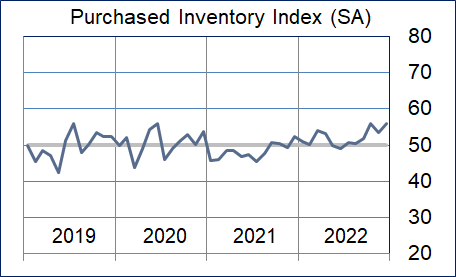
Purchased Inventory Index
The purchased inventory index rose this month with nonmanufacturing purchased inventories rising at a modest pace and manufacturing inventories rising at a rapid pace.
| Higher | Same | Lower | Net | Index | |
| Jul/22 | 9% | 85% | 6% | 3% | 50.8 |
| Aug/22 | 9% | 84% | 7% | 2% | 50.4 |
| Sep/22 | 6% | 88% | 6% | 0% | 51.9 |
| Oct/22 | 8% | 88% | 4% | 4% | 55.9 |
| Nov/22 | 9% | 86% | 5% | 4% | 53.5 |
| Dec/22 | 7% | 90% | 3% | 4% | 55.9 |
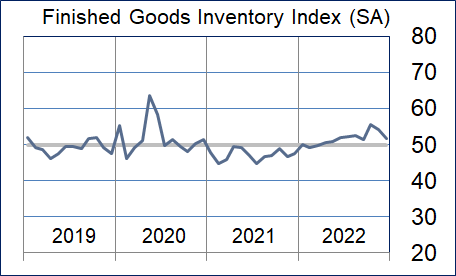
Finished Goods Inventory Index
The finished goods inventory index fell to near neutral. Manufacturing inventories fell at a rapid pace while nonmanufacturing inventories came in near neutral.
| Higher | Same | Lower | Net | Index | |
| Jul/22 | 8% | 88% | 4% | 4% | 52.1 |
| Aug/22 | 9% | 86% | 5% | 4% | 52.6 |
| Sep/22 | 7% | 87% | 6% | 1% | 51.4 |
| Oct/22 | 11% | 81% | 8% | 3% | 55.7 |
| Nov/22 | 14% | 82% | 4% | 10% | 54.1 |
| Dec/22 | 10% | 85% | 5% | 5% | 51.6 |
Background on the ISM-Houston Business Report and HPMI Calculation Methods
The Houston Purchasing Managers Index has been included as an integral part of the ISM-Houston Business Report since the Houston chapter of the Institute for Supply Management started publication of this document in January 1995. The report and index are published monthly as the primary deliverables from a survey of Houston area Supply Chain leaders regarding the status of key activities believed to provide insight into the strength of the economy. The respondents come from diverse organizations including construction, energy, engineering, health care, durable and non-durable goods manufacturing, financial and business services, wholesale and retail trade, and utilities related companies.
The Houston Purchasing Managers Index is determined from diffusion indices of the eight indicators of economic activity covered by the ISM-Houston Business Survey and Report. These underlying indicators are sales or new orders, production, employment, purchases, prices paid for major purchases, lead times from sellers, purchased materials inventory (raw materials and supplies), and finished goods inventories. The respondents to the survey report the direction of each these activities as either up, the same or down in comparison to the previous month. An index for each of these areas is then calculated by subtracting the percentage of respondents that sight a negative shift from the percentage that sight a positive shift. For indicators that are positively correlated with economic growth, this results in an underlying index that points to expansion when it is above zero. Indicators that are negatively correlated with growth point to expansion when they are below zero.
The final Houston PMI is calculated by applying optimal regression factors to each of the eight underlying indicators noted above. These regression factors are determined using standard regression techniques comparing these underlying indicators to the Houston-The Woodlands-Sugar Land Business Cycle Index (Houston BCI), which is reported on a monthly basis by the Federal Reserve Bank of Dallas. This top-level index is converted to a 0 to 100 scale to match that of the national Purchasing Managers Index® (PMI®) which is published monthly by the Institute for Supply Management® (ISM®). Readings over 50 for the HPMI generally indicate manufacturing expansion in the Houston in the near term and readings below 50 show coming manufacturing contraction.
It is important to note that the manufacturing breakeven HPMI does not equate to the breakeven point for the overall Houston economy. ISM-Houston periodically reviews the capability of its correlations and adjusts the regression factors when appropriate. The most recent revision occurred as a result of a review undertaken during the third quarter of 2018, which determined that changes in the Houston economy over the last decade have shifted the intercept of the correlation, causing a neutral Houston PMI to no longer align with a neutral Houston BCI. A Houston PMI of 45 points now equates to a neutral Houston economy as measured by the Houston BCI. A similar offset between the National PMI and the National economy has existed for some time.
Use of ISM-Houston Business Report Content
All information contained in this report is protected by copyright laws and ISM-Houston retains all rights to this Content. ISM-Houston hereby grants you a limited, revocable license to access, print, and display this Content solely for your personal, non-commercial use. Requests for permission to reproduce or redistribute ISM-Houston Business Report Content can be made by contacting the ISM-Houston Business Survey Committee at hpmi@ism-houston.org.
ISM-Houston shall not have any liability, duty, or obligation for or relating to the ISM-Houston Business Report Content or other information contained herein, any errors, inaccuracies, omissions or delays in providing any ISM-Houston Business Report Content, or for any actions taken in reliance thereon. In no event shall ISM-Houston be liable for any special, incidental, or consequential damages, arising out of the use of the ISM-Houston Business Report.