
(Houston, Texas) – According to Houston area supply chain executives, economic activity in Houston continued to expand for the month of August. The manufacturing sector saw a slight contraction, while the non-manufacturing sector saw expansion for the third straight month. The overall economy expanded for the 63rd month in a row.
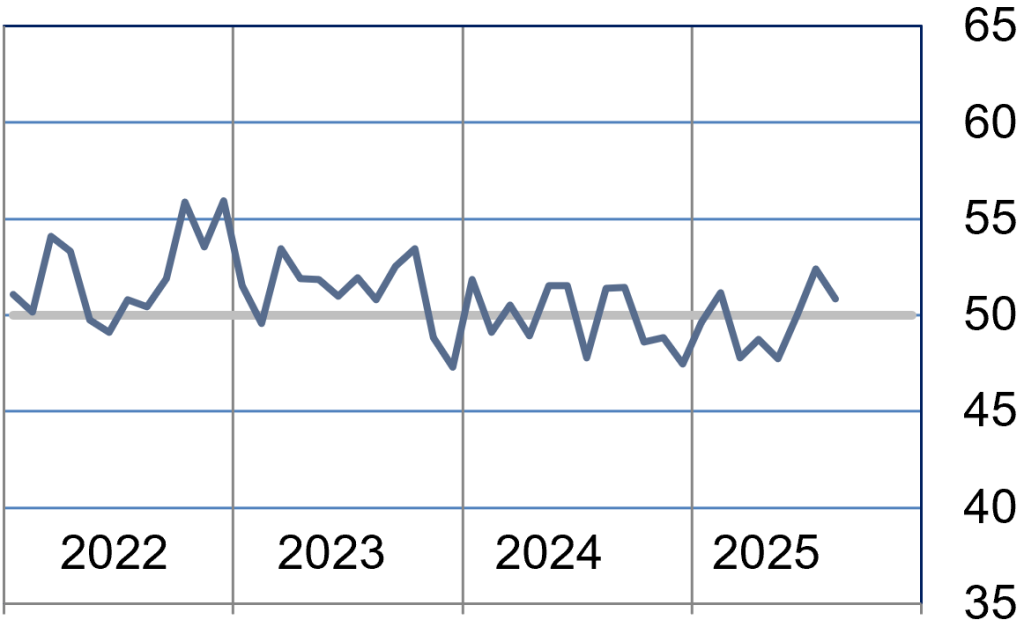
The Houston Purchasing Managers Index expanded to 52.8 points. The lead time, employment and sales/new order indexes, the three indicators with a strong positive correlation with the economy, all expanded for the first time in six months. Lead time rose 0.1 points to 53.6 points, while sales/new orders fell 3.0 points to 55.6 points. The employment index snapped four months of consecutive contraction to increase 2.9 points to 51.2 points. The finished goods inventory index, the underlying indicator that has the strongest inverse correlation with economic activity, fell 2.7 points to 50.4 points.
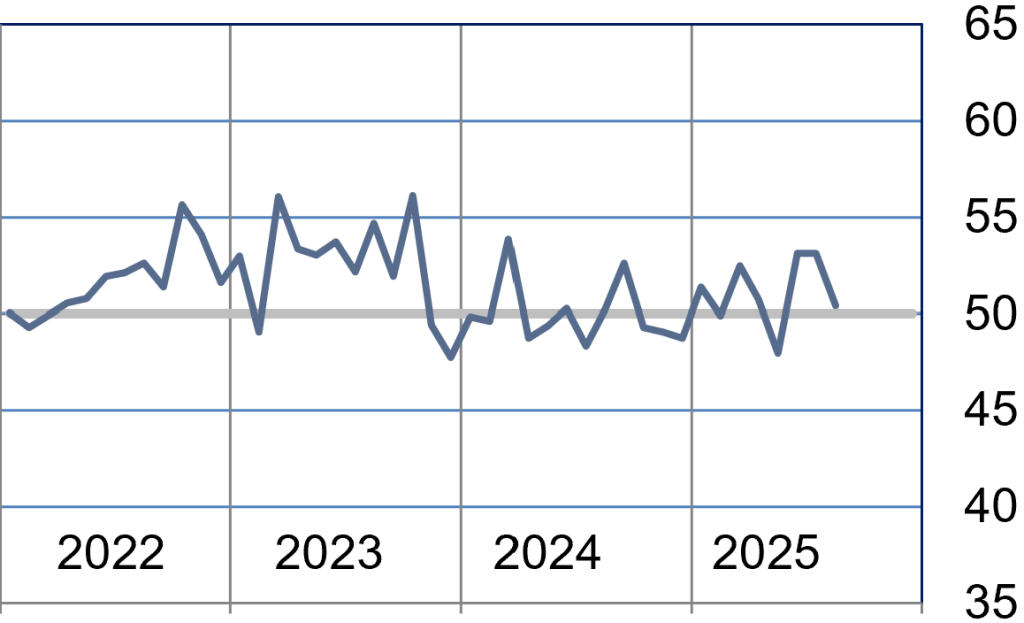
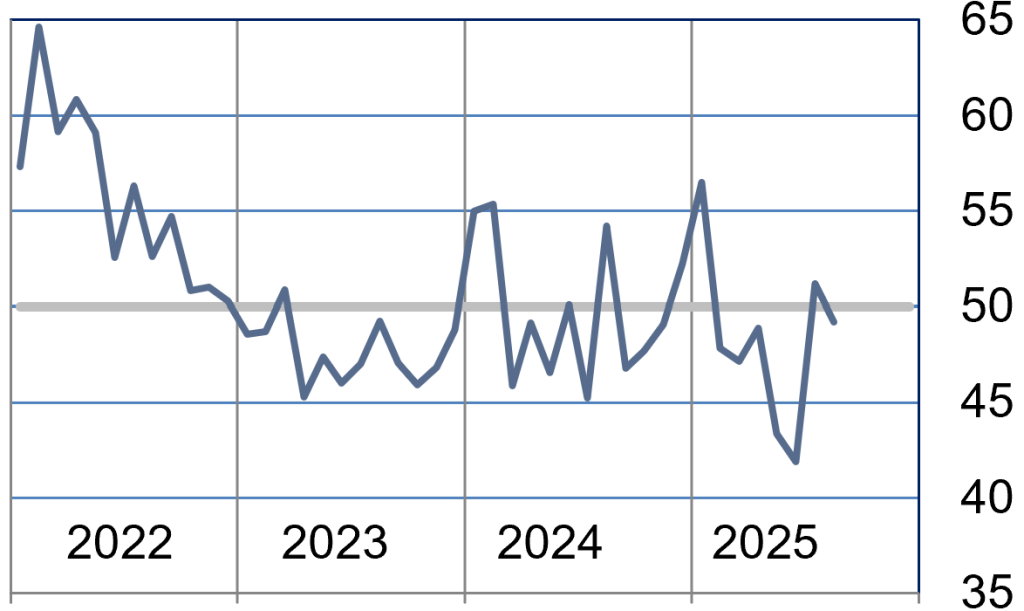
The Houston manufacturing PMI index fell 2.0 points during the month to 49.2 points; slipping back into contraction after one month of expansion. The nonmanufacturing PMI increased 1.0 points to 53.5 points.
On an industry specific basis: health care, trade, transportation and warehousing reported strong expansion. No sectors indicated significant contraction.
https://www.ism-houston.org/wp-content/uploads/2025/09/August-Full-Report.pdf
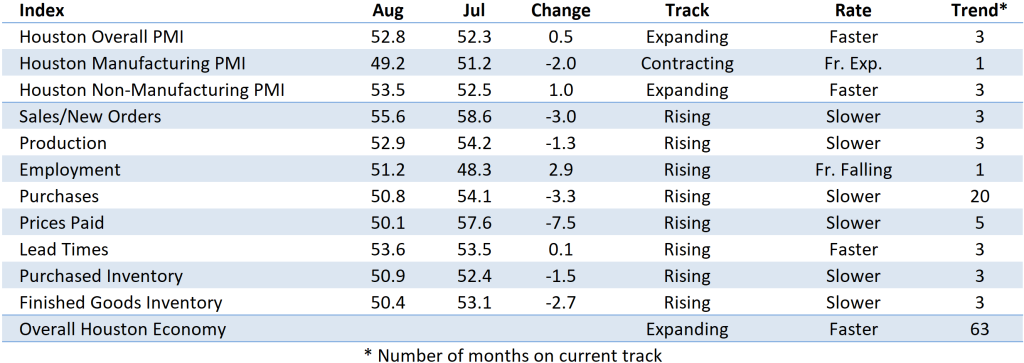
Indices at a Glance
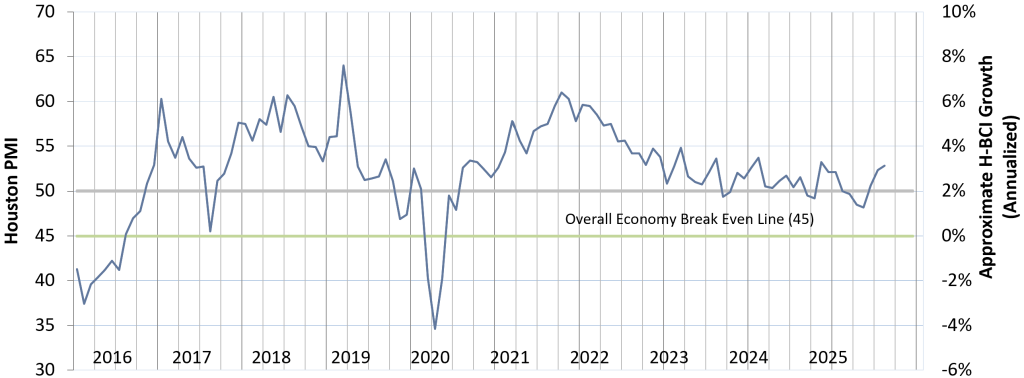
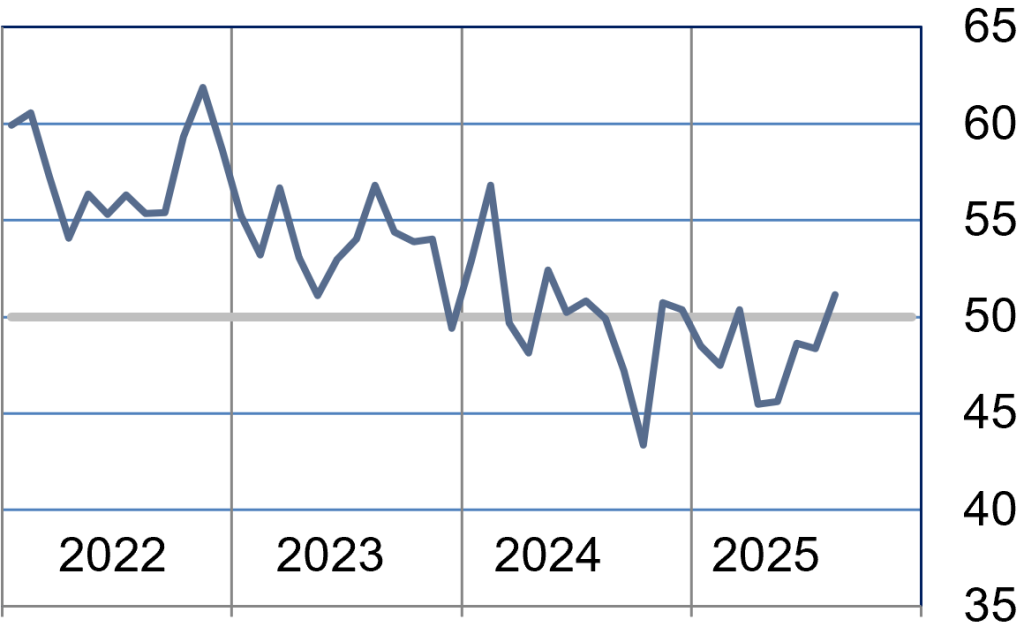
Houston PMI Trend
Houston PMI readings over 50 generally indicate that respondents see their activities as expanding. An HPMI above 45 normally correlates with expansion of the Houston-The Woodlands-Sugar Land Business Cycle Index (H-BCI).
Commodities Reported to have Notable Price Changes or to be in Short Supply
Up in Price: Labor related to managed services; electrical equipment, electrical commodities, carbon steel, non-domestic stainless steel, aluminum, copper; software and hardware
Down in Price: Crude oil, diesel, jet fuel, propane, natural gas, natural gas, natural gas liquids, ethane, ethylene, propylene; oil country tubular goods (OCTG), carbon steel, catalysts, nickel, copper, lumber, ocean container freight
In Short Supply: In Short Supply: Skilled labor; phthalic anhydride, perfluoroalkoxy alkane (PFA); electrical equipment, electrical bulks, electrical components, carbon steel
‡ reported as up or down by different respondents
What our Respondents are Saying
Oil and Gas Exploration, and Key Support Services:
- Projects delayed due to much uncertainty
- We are seeing significant port congestion
- Tarriff impacts still somewhat unknown and reviewing strategies
- This sector saw slight expansion in August, reversing course from July. The sales index expanded at a slower rate than July; however, employment saw contracted at a slower rate as well. Purchased inventory saw a steep contraction, reversing course from July
Construction:
- The number of new nuclear projects planned for the US continues to increase; the supply chain will require significant expansion in capacity and capability to meet the demand
- Motor fuel prices fell in August
- This sector slipped flipped back to contraction after flipping each of the previous two months. Employment flipped from moderate expansion to deep contraction. Lead time also expanded at a much slower rate than July. The sales index still expanded but was just above neutral
Durable Goods Manufacturing:
- This sector contracted faster the month of August. Besides the production index, all indexes saw fell during the month. The purchases index has been on a steady decline and the purchased inventory index is following the same trajectory. The production index saw strong improvement and approached the neutral position.
Non-durable Goods Manufacturing:
- Olefins cracker feedstock and product prices remain low
- Refinery rates continue at high levels, but should fall as we move out of the summer driving season
- This sector expanded for the second month in a row; however, at a slower rate than July. The sales and purchase indexes slipped from strong expansion to just above neutral. The price, lead time and purchased inventory indexes saw strong expansion.
Wholesale and Retail Trade:
- Defense spending still holding
- Tariffs affecting demand and also leading to price rises
- The trade sector expanded at a slower rate in August but still saw strong expansion. The price paid index flipped form expansion to steep contraction.
Health Care:
- This sector continues to indicate strong expansion with only the prices paid index indicating contraction. The employment index saw faster expansion in August.
Professional and Business Services:
- Rates for professional services and general staffing remain very flat
- Except for unique job requirements, there is no shortage of supply in our market
- Even though the availability of qualified people exceeds the opportunities, we do not see any significant reductions in what companies are willing to pay when they are hiring
- Energy Company’s view of their performance during the first half will drive hiring additions; we may see more layoffs and/or internal restructuring of staff organizations if oil remains in the $60-65/barrel range
- This sector’s performance continued slight expansion in July, with stronger expansion in sales. The production index still contracted but was just under neutral. The employment index and purchases index continued to see expansion. Lead times expanded at a much slower rate, just above neutral.
Transportation:
- Breakbulk and container shipping costs have fallen all summer
- Houston air-passenger traffic rose in July, consistent with normal seasonal changes
- The transportation sector saw faster expansion in August. The sales, prices paid, lead time and purchased inventory sectors saw strong expansion. Employment also saw slight expansion.
Trend of Underlying Indicators
The Houston PMI is based on diffusion indices for eight underlying indicators. The net value of each indicator is simply the percentage of respondents who cite a positive shift from the previous month minus the percentage who cite a negative shift. The diffusion index is calculated based on the percent of respondents reporting higher results plus one-half of those responding the same with seasonal adjustments to the Sales/New Orders, Production, Employment, and Prices Paid indices based on an X13 ARIMA forecast. Values above 50 for Sales/New Orders, Production, Employment, Prices Paid, and Lead Times generally point towards expansion and values below 50 signal contraction. Note that the Prices Paid Index may not follow this trend late in an economic expansion. The Inventory measures have an inverse correlation at most forecast horizons, meaning that values below 50 point to expansion and values above point to contraction. The Purchases index is inversely correlated with economic activity at the three-month forecast horizon.
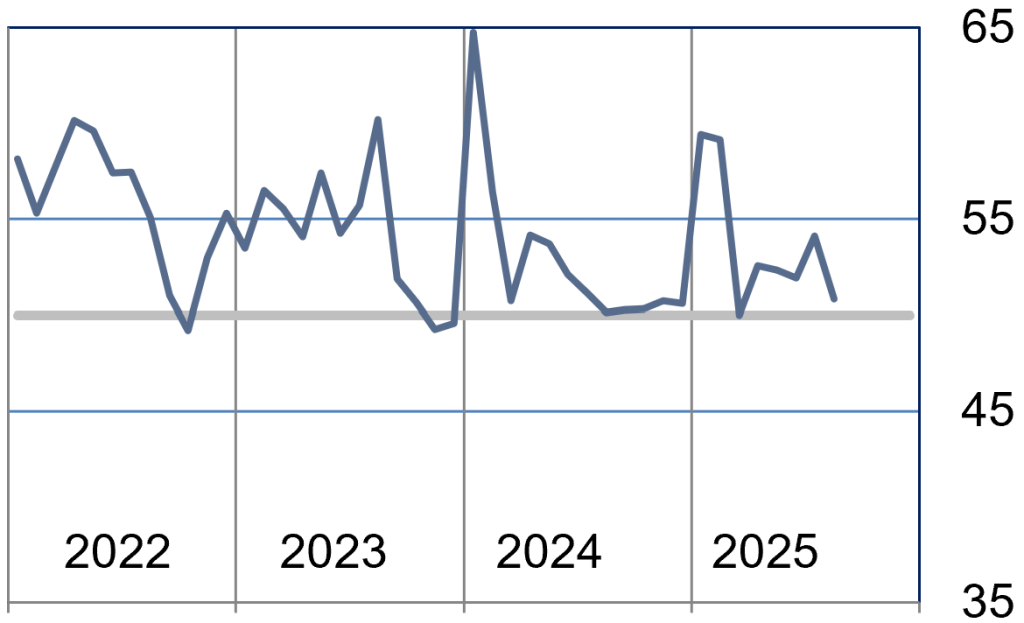
Sales/New Orders (Seasonally Adjusted)
The sales index continued expanding in August. The manufacturing sector slipped back into contraction and the non-manufacturing sector expanded at a slower rate.
| Higher | Same | Lower | Net | Index | |
| Mar/25 | 14% | 74% | 12% | 2% | 49.4 |
| Apr/25 | 16% | 71% | 13% | 3% | 49.3 |
| May/25 | 15% | 75% | 10% | 5% | 49.6 |
| Jun/25 | 20% | 67% | 13% | 7% | 53.6 |
| Jul/25 | 20% | 75% | 5% | 15% | 58.6 |
| Aug/25 | 14% | 82% | 4% | 10% | 55.6 |
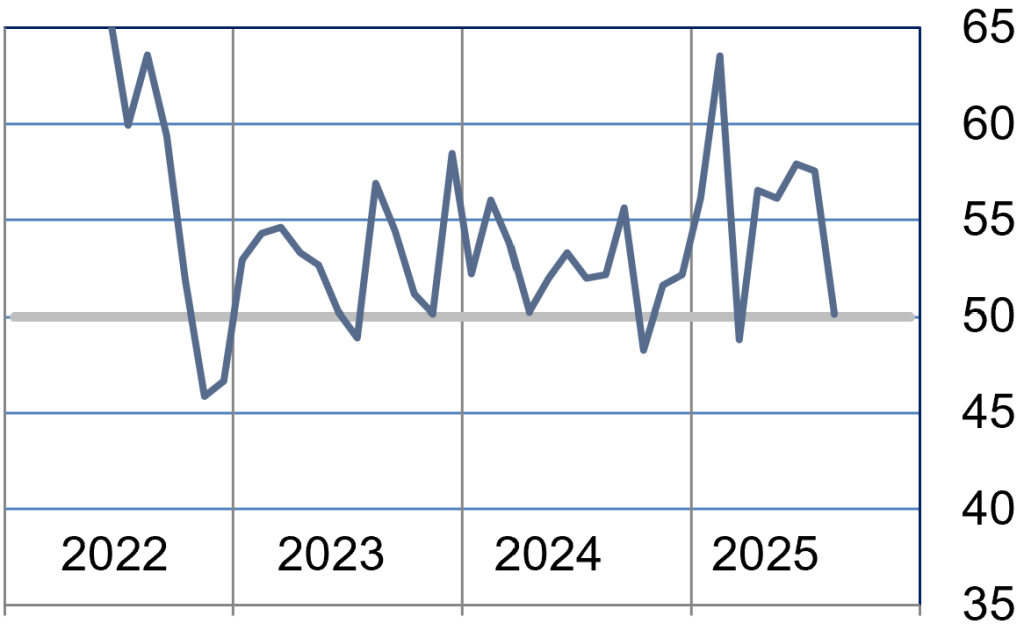
Production Index (Seasonally Adjusted)
The production index continued to expand but at a slower rate than July. Both indexes slipped, with the manufacturing sector falling into contraction. The non-manufacturing sector expanded at a slower rate.
| Higher | Same | Lower | Net | Index | |
| Mar/25 | 8% | 85% | 7% | 1% | 49.2 |
| Apr/25 | 8% | 85% | 7% | 1% | 50.0 |
| May/25 | 6% | 88% | 6% | 0% | 48.9 |
| Jun/25 | 14% | 78% | 8% | 6% | 53.6 |
| Jul/25 | 12% | 86% | 2% | 10% | 54.2 |
| Aug/25 | 10% | 87% | 3% | 7% | 52.9 |
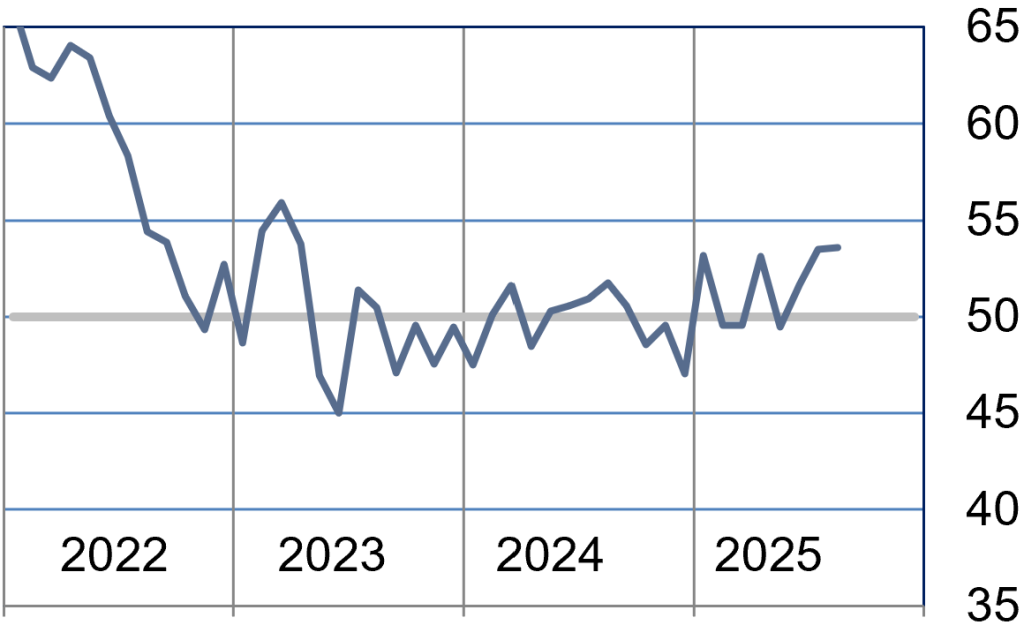
Employment Index (Seasonally Adjusted)
The employment index flipped from contraction to expansion this month. The non-manufacturing sector flipped to expansion and manufacturing contracted at a slower rate.
| Higher | Same | Lower | Net | Index | |
| Mar/25 | 9% | 83% | 8% | 1% | 50.4 |
| Apr/25 | 5% | 84% | 11% | -6% | 45.5 |
| May/25 | 9% | 75% | 16% | -7% | 45.6 |
| Jun/25 | 8% | 83% | 9% | -1% | 48.6 |
| Jul/25 | 6% | 84% | 10% | -4% | 48.3% |
| Aug/25 | 9% | 82% | 9% | 0% | 51.2 |
Purchases Index (Not Seasonally Adjusted)
The purchase index saw moderate expansion in August. The manufacturing sector slipped back into contraction and the non-manufacturing sector expanded at a slower rate
| Higher | Same | Lower | Net | Index | |
| Mar/25 | 11% | 80% | 9% | 2% | 50.0 |
| Apr/25 | 19% | 73% | 8% | 11% | 52.6 |
| May/25 | 16% | 76% | 8% | 8% | 52.3 |
| Jun/25 | 14% | 75% | 11% | 3% | 51.9 |
| Jul/25 | 13% | 82% | 5% | 8% | 54.1% |
| Aug/25 | 7% | 87% | 6% | 1% | 50.8 |
Prices Paid Index (Seasonally Adjusted)
The prices paid index expanded at a much slower rate in August. The manufacturing sector continues to bolster this index with strong expansion. The non-manufacturing sector flipped to contraction.
| Higher | Same | Lower | Net | Index | |
| Mar/25 | 13% | 76% | 11% | 2% | 48.8 |
| Apr/25 | 18% | 79% | 3% | 15% | 56.5 |
| May/25 | 17% | 80% | 3% | 14% | 56.1 |
| Jun/25 | 18% | 78% | 4% | 14% | 57.9 |
| Jul/25 | 17% | 80% | 3% | 14% | 57.6 |
| Aug/25 | 12% | 77% | 11% | 1% | 50.1 |
Lead Times Index (Not Seasonally Adjusted)
The lead time index indicated moderate expansion in August with little change in sector performance. The manufacturing sector expanded at a slightly higher rate and non-manufacturing was unchanged.
| Higher | Same | Lower | Net | Index | |
| Mar/25 | 8% | 89% | 3% | 5% | 49.6 |
| Apr/25 | 11% | 87% | 2% | 9% | 53.1 |
| May/25 | 4% | 93% | 3% | 1% | 49.5 |
| Jun/25 | 6% | 91% | 3% | 3% | 51.7 |
| Jul/25 | 10% | 88% | 2% | 8% | 53.5% |
| Aug/25 | 8% | 90% | 2% | 6% | 53.6% |
Purchased Inventory Index (Not Seasonally Adjusted)
The purchased inventory index saw slight expansion in August. Both the manufacturing and non-manufacturing sector expanded but the non-manufacturing sector saw slower expansion.
| Higher | Same | Lower | Net | Index | |
| Mar/25 | 6% | 87% | 7% | -1% | 47.8 |
| Apr/25 | 2% | 93% | 5% | -3% | 48.7 |
| May/25 | 2% | 94% | 4% | -2% | 47.7 |
| Jun/25 | 6% | 89% | 5% | 1% | 50.0 |
| Jul/25 | 6% | 91% | 3% | 3% | 52.4% |
| Aug/25 | 7% | 89% | 4% | 3% | 50.9 |
Finished Goods Inventory Index (Not Seasonally Adjusted)
The finished goods inventory index saw slight expansion in August. Driven by slower expansion in non-manufacturing. The manufacturing sector also saw very slight expansion.
| Higher | Same | Lower | Net | Index | |
| Mar/25 | 7% | 91% | 2% | 5% | 52.5 |
| Apr/25 | 5% | 91% | 4% | 1% | 50.7 |
| May/25 | 2% | 92% | 6% | -4% | 48.0 |
| Jun/25 | 9% | 88% | 3% | 6% | 53.1 |
| Jul/25 | 8% | 90% | 2% | 6% | 53.1 |
| Aug/25 | 5% | 91% | 4% | 1% | 50.4 |
Projections for Key Long-Term Indicators
In addition to the current status of business activities, respondents to the ISM-Houston Business Survey also provide feedback on their view of the direction of the sales/new orders and employment indices six months into the future.
Six-Month Projection of the Sales/New Orders Index
The future sales index indicates we will see slight contraction. The manufacturing sector is indicating weakness but the non-manufacturing sector still indicating expansion.
| Higher | Same | Lower | Net | Index | |
| Mar/25 | 11% | 80% | 9% | 2% | 47.2 |
| Apr/25 | 19% | 73% | 8% | 11% | 48.9 |
| May/25 | 16% | 76% | 8% | 8% | 43.4 |
| Jun/25 | 14% | 75% | 11% | 3% | 41.9 |
| Jul/25 | 13% | 82% | 5% | 8% | 51.2 |
| Aug/25 | 7% | 87% | 6% | 1% | 49.2 |
Six Month Projection of Employment Index
The future employment index continues to indicate expansion. The non-manufacturing sector is indicating faster expansion; however, the manufacturing sector is indicating faster contraction.
| Higher | Same | Lower | Net | Index | |
| Mar/25 | 19% | 71% | 10% | 9% | 50.2 |
| Apr/25 | 13% | 72% | 15% | -2% | 48.5 |
| May/25 | 12% | 75% | 13% | -1% | 49.1 |
| Jun/25 | 13% | 77% | 10% | 3% | 51.7 |
| Jul/25 | 10% | 83% | 7% | 3% | 52.5 |
| Aug/25 | 18% | 69% | 13% | 5% | 53.5 |
Background on the ISM-Houston Business Report and HPMI Calculation Methods
The Houston Purchasing Managers Index has been included as an integral part of the ISM-Houston Business Report since the Houston chapter of the Institute for Supply Management started publication of this document in January 1995. The report and index are published monthly as the primary deliverables from a survey of Houston area Supply Chain leaders regarding the status of key activities believed to provide insight into the strength of the economy. The respondents come from diverse organizations including construction, energy, engineering, health care, durable and non-durable goods manufacturing, financial and business services, wholesale and retail trade, and utilities related companies.
The Houston Purchasing Managers Index is determined from diffusion indices of the eight indicators of economic activity covered by the ISM-Houston Business Survey and Report. These underlying indicators are sales or new orders, production, employment, purchases, prices paid for major purchases, lead times from sellers, purchased materials inventory (raw materials and supplies), and finished goods inventories. The respondents to the survey report the direction of each these activities as either up, the same or down in comparison to the previous month. An index for each of these areas is then calculated by subtracting the percentage of respondents that sight a negative shift from the percentage that sight a positive shift. For indicators that are positively correlated with economic growth, this results in an underlying index that points to expansion when it is above zero. Indicators that are negatively correlated with growth point to expansion when they are below zero.
The final Houston PMI is calculated by applying optimal regression factors to each of the eight underlying indicators noted above. These regression factors are determined using standard regression techniques comparing these underlying indicators to the Houston-The Woodlands-Sugar Land Business Cycle Index (Houston BCI), which is reported on a monthly basis by the Federal Reserve Bank of Dallas. This top-level index is converted to a 0 to 100 scale to match that of the national Purchasing Managers Index® (PMI®) which is published monthly by the Institute for Supply Management® (ISM®). Readings over 50 for the HPMI generally indicate manufacturing expansion in the Houston in the near term and readings below 50 show coming manufacturing contraction.
It is important to note that the manufacturing breakeven HPMI does not equate to the breakeven point for the overall Houston economy. ISM-Houston periodically reviews the capability of its correlations and adjusts the regression factors when appropriate. The most recent revision occurred as a result of a review undertaken during the third quarter of 2018, which determined that changes in the Houston economy over the last decade have shifted the intercept of the correlation, causing a neutral Houston PMI to no longer align with a neutral Houston BCI. A Houston PMI of 45 points now equates to a neutral Houston economy as measured by the Houston BCI. A similar offset between the National PMI and the National economy has existed for some time.
Use of ISM-Houston Business Report Content
All information contained in this report is protected by copyright laws and ISM-Houston retains all rights to this Content. ISM-Houston hereby grants you a limited, revocable license to access, print, and display this Content solely for your personal, non-commercial use. Requests for permission to reproduce or redistribute ISM-Houston Business Report Content can be made by contacting the ISM-Houston Business Survey Committee at hpmi@ism-houston.org.
ISM-Houston shall not have any liability, duty, or obligation for or relating to the ISM-Houston Business Report Content or other information contained herein, any errors, inaccuracies, omissions or delays in providing any ISM-Houston Business Report Content, or for any actions taken in reliance thereon. In no event shall ISM-Houston be liable for any special, incidental, or consequential damages, arising out of the use of the ISM-Houston Business Report.