
For release September 11, 2023
August ISM-Houston Business Report
Houston PMI at 53.6 (up 1.5 points)
Sales/New Orders Expanding
Production Expanding
Employment Expanding
Prices Paid Expanding
Lead Times Expanding
Finished Goods Inventories Expanding
(Houston, Texas) – According to Houston area supply chain executives, economic activity in Houston expanded at modestly faster pace in August. Manufacturing reported contraction at a very slow pace and nonmanufacturing expanded at a minimally faster rate than last month.
The Houston Purchasing Managers Index rose 1.5 points to 53.6. All three of the underlying indicators that have the strongest positive correlation with the Houston economy (sales/new orders, employment, and lead times) continue to point to modest to strong economic expansion. The sales/new orders index rose 2.8 points to 54.0. The employment index rose 2.8 points to 56.8. The lead times index fell 0.9 points to 50.5. The finished goods inventory index, the underlying indicator that has the strongest inverse correlation with economic activity, rose 2.5 points to 54.7, giving a stronger signal of potential economic contraction.
The Houston Manufacturing PMI rose 2.3 points to 49.3, providing a minimal indication of contraction in this sector. The nonmanufacturing PMI rose 1.4 points to 54.6, showing a modestly higher expansion rate for the industries in this sector.
On an industry specific basis health care, professional and management services, trade, transportation & warehousing, and construction reported moderate to strong expansion. Oil & gas reported minimal expansion. Manufacturing and real estate continue to report low to moderate contraction.
The Houston PMI provides a measure of current economic activity in the greater Houston area and a forecast of likely shifts in activity over a three-month forecast horizon. These indicators have a possible range of 0 to 100. Readings over 50 generally indicate goods producing industry expansion; readings below 50 show contraction. A PMI above 45 generally correlates with expansion of the Houston-The Woodlands-Sugar Land Business Cycle Index. The current and forecast PMI indices are based on diffusion indices for eight underlying indicators: Sales/New Orders, Production, Employment, Purchases, Prices Paid, Lead Times, Purchase Inventory, and Finished Goods Inventory.
Click here to see the PDF version of the full report.
Indices at a Glance

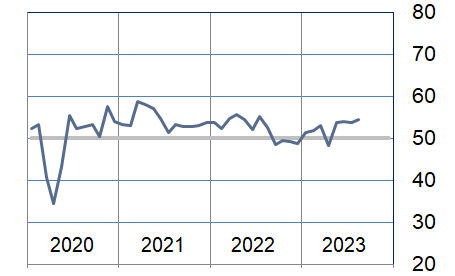
Houston PMI Trend
Houston PMI readings over 50 generally indicate that respondents see their activities as expanding. An HPMI above 45 normally correlates with expansion of the Houston-The Woodlands-Sugar Land Business Cycle Index (H-BCI).

Commodities Reported to have Notable Price Changes or to be in Short Supply
Up in Price: General labor, craft labor, temporary staffing; crude oil, gasoline, diesel, jet fuel, natural gas, natural gas liquids, propane, normal butane, isobutane, natural gasoline, naphtha, carbon steel‡, premium alloy steel‡, compressors; bulk ocean freight, ocean container freight.
Down in Price: Oil field chemicals, proppant, hydraulic fracturing equipment; rotating equipment, piping products, carbon and alloy steel‡, hot rolled coil, lined pipe, bulk materials, nickel, platinum, magnesium, lumber; motor vehicles; truck freight, breakbulk shipping.
In Short Supply: General labor, craft labor, specialized construction labor; fluoropolymers (PFAs), rare earths, lithium; fasteners, non-metallic commodities, compressors, automation equipment, power supplies, electronics, electrical gear, electrical components, transformers, wire & cable, HVAC equipment.
‡ reported as up or down by different respondents
What our Respondents are Saying
Oil and Gas Exploration, and Key Support Services:
- Foreseeing slight deflation (less than 5%) going into 4Q23.
- Extended lead times for electrical and automation equipment.
- U.S. and Texas rig counts continue to fall.
- This sector’s performance fell to expanding at a very minimal rate; the purchases index continued to show strength, while all other indices, including the employment index, reported near neutral.
Construction:
- Some HVAC activities are being slowed due to upstream parts and components.
- Not seeing major supply issues, but lead times remain unpredictable.
- Performance in this sector continued to show modest to strong growth; the employment index pointed to expansion at a rapid pace; the prices paid and lead times indies fell to levels indicating potential contraction; all other indices remained near neutral.
Durable Goods Manufacturing:
- New sales orders remain strong on an overall basis for this year compared to last year.
- Lead times on both domestic and international supplies have improved over the course of the year.
- Pricing has mostly stabilized but we remain cautious as inflation is still an ongoing challenge.
- New business nearly non-existent lately.
- This sector’s performance improved significantly and reported near neutral month over month; the sales/new orders, production, employment, and inventory indices all expanded at a rapid pace, while the purchases and lead times indices showed significant contraction.
Non-durable Goods Manufacturing:
- Activities are stable for now.
- Demand headwinds continue in the chemical manufacturing sector.
- Companies are focusing on right-shoring of workforce.
- We are still concerned about olefins not recovering as soon as desired.
- Demand for fuel components is still down due to miles driven still being down from normal levels.
- Construction material demand is lax.
- Blending component demand to refineries remains suppressed.
- This sector’s performance stayed near neutral with support from strong prices paid and lead times indices; the sales/new orders, production, employment, purchases indices were all reported as contracting at a moderate to strong pace; finished goods inventories rose.
Trade, Transportation, and Warehousing:
- Year to date Houston air passenger totals are near 2019 levels.
- Container traffic through the port of Houston remains strong.
- This sector indicated good performance again this month with the prices paid index joining the sales/new orders, and purchases indices in reporting considerable strength; all other indices came in near neutral.
Real-Estate Services:
- New and existing home listings continue to show strength but are running below last year’s levels.
- New home sellers continue to use loan rate buydowns, but these are being reduced.
- While apartment occupancy rates are down from last year, rental rates remain strong.
- Hotel occupancy and room rates continue to increase.
- This sector’s performance remained modestly below neutral with new homes reporting above neutral; industrial and retail real estate reporting at neutral; office real estate continues to show significant weakness.
Health Care:
- Entering a period of growth as we expand the footprint of our operations; will be adding 20 more locations by end of 2024 with an additional 10-20 in 2025.
- Elevator installs are extremely short staffed, bringing in out of town labor.
- Expecting price increases near term as individual contracts expire and renew.
- This sector reported modest to strong growth again this month; the sales/new orders, purchases, and lead times indices showed continued strength while the employment index returned to near neutral; the inventory indices continue to run extremely high.
Professional and Business Services:
- Companies are beginning to require more time in the office for those who have been primarily teleworking, which is requiring telework procedures to be modified as companies look for the right balance.
- Hiring of employees, consultants, and temporary workers remained flat as the summer came to a close.
- Companies across most industries are being very cautious about adding labor cost by hiring any form of worker as concerns about recession, and an economy that is growing more slowly, continues.
- Many organizations are not expecting the annual uptick in hiring that often occurs between the end of summer and start of the year-end holiday season.
- Budget cycles are just around the corner.
- We will be interested to see how companies in Houston gauge future business for 2024 which will have significant bearing on how they staff, both hourly project as well as direct hire.
- ·The Houston market remains very stable in terms of companies hiring for open positions: many openings are present and candidates are reluctant to seek new opportunities. This has been the case for several months despite the price of oil being at or above $80/bbl.
- Prices being paid for hourly pay or direct hire salaries have been level for past several months. Will be interesting to see how the upcoming budget cycle predicts what hiring will be like in 2024.
- This sector reported modestly higher expansion again this month with the employment index joining the purchases index indicating significant strength; the sales/new orders index was reported as contracting at a modest pace; all other indices were reported near neutral.
Government:
- Expected to spend about $900 million in grant funds in the next 24-36 months.
- Majority of commodities are returning to normal supply availability.
- Construction Materials continue to stay high.
- Vehicles are returning to reasonable cost.
- This sector’s performance rose to well above neutral with the employment, purchases, and prices paid indices showing considerable strength; all other indices were reported near neutral.
Trend of Underlying Indicators
The Houston PMI is based on diffusion indices for eight underlying indicators. The net value of each indicator is simply the percentage of respondents who cite a positive shift from the previous month minus the percentage who cite a negative shift. The diffusion index is calculated based on the percent of respondents reporting higher results plus one-half of those responding the same with seasonal adjustments to the Sales/New Orders, Production, Employment, and Prices Paid indices based on an X13 ARIMA forecast. Values above 50 for Sales/New Orders, Production, Employment, Prices Paid, and Lead Times generally point towards expansion and values below 50 signal contraction. Note that the Prices Paid Index may not follow this trend late in an economic expansion. The Inventory measures have an inverse correlation at most forecast horizons, meaning that values below 50 point to expansion and values above point to contraction. The Purchases index is inversely correlated with economic activity at the three-month forecast horizon.
Sales/New Orders (Seasonally Adjusted)
The sales/new orders index expanded at a faster rate during the month. The expansion rate for nonmanufacturing was relatively unchanged while manufacturing contracted at a significant slower pace.
| Higher | Same | Lower | Net | Index | |
| Mar/23 | 17% | 76% | 7% | 10% | 54.7 |
| Apr/23 | 12% | 81% | 7% | 5% | 49.6 |
| May/23 | 19% | 75% | 6% | 13% | 54.9 |
| Jun/23 | 11% | 80% | 9% | 2% | 52.9 |
| Jul/23 | 13% | 75% | 12% | 1% | 51.2 |
| Aug/23 | 16% | 78% | 6% | 10% | 54.0 |

Production Index (Seasonally Adjusted)
The production index was modestly higher this month with nonmanufacturing expanding at a minimally slower rate while manufacturing improved significantly to show expansion at just above neutral.
| Higher | Same | Lower | Net | Index | |
| Mar/23 | 13% | 80% | 7% | 6% | 53.2 |
| Apr/23 | 9% | 85% | 6% | 3% | 48.2 |
| May/23 | 11% | 86% | 3% | 8% | 53.8 |
| Jun/23 | 11% | 83% | 6% | 5% | 54.0 |
| Jul/23 | 17% | 74% | 9% | 8% | 53.9 |
| Aug/23 | 12% | 85% | 3% | 9% | 54.5 |
Employment Index (Seasonally Adjusted)
The employment index rose to show a moderately higher expansion rate. Nonmanufacturing improved significantly to indicate strong expansion while this index fell to near neutral for manufacturing.
| Higher | Same | Lower | Net | Index | |
| Mar/23 | 23% | 69% | 8% | 15% | 56.7 |
| Apr/23 | 18% | 78% | 4% | 14% | 53.1 |
| May/23 | 12% | 80% | 8% | 4% | 51.1 |
| Jun/23 | 15% | 80% | 5% | 10% | 53.0 |
| Jul/23 | 14% | 82% | 4% | 10% | 54.0 |
| Aug/23 | 13% | 82% | 5% | 8% | 56.8 |

Purchases Index (Not Seasonally Adjusted)
The purchases index rose to show expansion at a fast rate led by strong improvements in the nonmanufacturing sectors. Manufacturing continues to show a significant rate of contraction for this index.
| Higher | Same | Lower | Net | Index | |
| Mar/23 | 16% | 79% | 5% | 11% | 55.5 |
| Apr/23 | 17% | 74% | 9% | 8% | 54.1 |
| May/23 | 19% | 77% | 4% | 15% | 57.4 |
| Jun/23 | 14% | 80% | 6% | 8% | 54.3 |
| Jul/23 | 19% | 73% | 8% | 11% | 55.7 |
| Aug/23 | 27% | 67% | 6% | 21% | 60.2 |

Prices Paid Index (Seasonally Adjusted)
The prices paid index rose significantly to indicate faster price expansion led by the nonmanufacturing sectors. Manufacturing prices expanded at a minimally slower rate.
| Higher | Same | Lower | Net | Index | |
| Mar/23 | 24% | 69% | 7% | 17% | 54.6 |
| Apr/23 | 11% | 85% | 4% | 7% | 53.3 |
| May/23 | 13% | 78% | 9% | 4% | 52.6 |
| Jun/23 | 9% | 77% | 14% | -5% | 50.3 |
| Jul/23 | 8% | 82% | 10% | -2% | 48.9 |
| Aug/23 | 17% | 78% | 5% | 12% | 56.9 |

Lead Times Index (Not Seasonally Adjusted)
The lead times index rose back moderated minimally to just above neutral. Manufacturing reported significant increases in this index while nonmanufacturing reported near neutral again this month.
| Higher | Same | Lower | Net | Index | |
| Mar/23 | 20% | 71% | 9% | 11% | 55.9 |
| Apr/23 | 12% | 83% | 5% | 7% | 53.8 |
| May/23 | 8% | 78% | 14% | -6% | 46.9 |
| Jun/23 | 5% | 80% | 15% | -10% | 45.0 |
| Jul/23 | 12% | 79% | 9% | 3% | 51.4 |
| Aug/23 | 9% | 83% | 8% | 1% | 50.5 |

Purchased Inventory Index (Not Seasonally Adjusted)
The purchased inventory index fell to near neutral. Nonmanufacturing was relatively unchanged. Manufacturing reported significant contraction in these inventories.
| Higher | Same | Lower | Net | Index | |
| Mar/23 | 10% | 86% | 4% | 6% | 53.4 |
| Apr/23 | 12% | 79% | 9% | 3% | 51.9 |
| May/23 | 8% | 88% | 4% | 4% | 51.9 |
| Jun/23 | 8% | 86% | 6% | 2% | 51.0 |
| Jul/23 | 8% | 88% | 4% | 4% | 52.0 |
| Aug/23 | 6% | 89% | 5% | 1% | 50.8 |

Finished Goods Inventory Index (Not Seasonally Adjusted)
The purchased inventory index rose to indicate expansion at a faster pace with most of the inventory change seen in manufacturing.
| Higher | Same | Lower | Net | Index | |
| Mar/23 | 16% | 80% | 4% | 12% | 56.1 |
| Apr/23 | 11% | 85% | 4% | 7% | 53.3 |
| May/23 | 9% | 88% | 3% | 6% | 53.0 |
| Jun/23 | 10% | 87% | 3% | 7% | 53.7 |
| Jul/23 | 9% | 86% | 5% | 4% | 52.1 |
| Aug/23 | 12% | 85% | 3% | 9% | 54.7 |

Background on the ISM-Houston Business Report and HPMI Calculation Methods
The Houston Purchasing Managers Index has been included as an integral part of the ISM-Houston Business Report since the Houston chapter of the Institute for Supply Management started publication of this document in January 1995. The report and index are published monthly as the primary deliverables from a survey of Houston area Supply Chain leaders regarding the status of key activities believed to provide insight into the strength of the economy. The respondents come from diverse organizations including construction, energy, engineering, health care, durable and non-durable goods manufacturing, financial and business services, wholesale and retail trade, and utilities related companies.
The Houston Purchasing Managers Index is determined from diffusion indices of the eight indicators of economic activity covered by the ISM-Houston Business Survey and Report. These underlying indicators are sales or new orders, production, employment, purchases, prices paid for major purchases, lead times from sellers, purchased materials inventory (raw materials and supplies), and finished goods inventories. The respondents to the survey report the direction of each these activities as either up, the same or down in comparison to the previous month. An index for each of these areas is then calculated by subtracting the percentage of respondents that sight a negative shift from the percentage that sight a positive shift. For indicators that are positively correlated with economic growth, this results in an underlying index that points to expansion when it is above zero. Indicators that are negatively correlated with growth point to expansion when they are below zero.
The final Houston PMI is calculated by applying optimal regression factors to each of the eight underlying indicators noted above. These regression factors are determined using standard regression techniques comparing these underlying indicators to the Houston-The Woodlands-Sugar Land Business Cycle Index (Houston BCI), which is reported on a monthly basis by the Federal Reserve Bank of Dallas. This top-level index is converted to a 0 to 100 scale to match that of the national Purchasing Managers Index® (PMI®) which is published monthly by the Institute for Supply Management® (ISM®). Readings over 50 for the HPMI generally indicate manufacturing expansion in the Houston in the near term and readings below 50 show coming manufacturing contraction.
It is important to note that the manufacturing breakeven HPMI does not equate to the breakeven point for the overall Houston economy. ISM-Houston periodically reviews the capability of its correlations and adjusts the regression factors when appropriate. The most recent revision occurred as a result of a review undertaken during the third quarter of 2018, which determined that changes in the Houston economy over the last decade have shifted the intercept of the correlation, causing a neutral Houston PMI to no longer align with a neutral Houston BCI. A Houston PMI of 45 points now equates to a neutral Houston economy as measured by the Houston BCI. A similar offset between the National PMI and the National economy has existed for some time.
Use of ISM-Houston Business Report Content
All information contained in this report is protected by copyright laws and ISM-Houston retains all rights to this Content. ISM-Houston hereby grants you a limited, revocable license to access, print, and display this Content solely for your personal, non-commercial use. Requests for permission to reproduce or redistribute ISM-Houston Business Report Content can be made by contacting the ISM-Houston Business Survey Committee at hpmi@ism-houston.org.
ISM-Houston shall not have any liability, duty, or obligation for or relating to the ISM-Houston Business Report Content or other information contained herein, any errors, inaccuracies, omissions or delays in providing any ISM-Houston Business Report Content, or for any actions taken in reliance thereon. In no event shall ISM-Houston be liable for any special, incidental, or consequential damages, arising out of the use of the ISM-Houston Business Report.