
For release September 12, 2022
August 2022 ISM-Houston Business Report
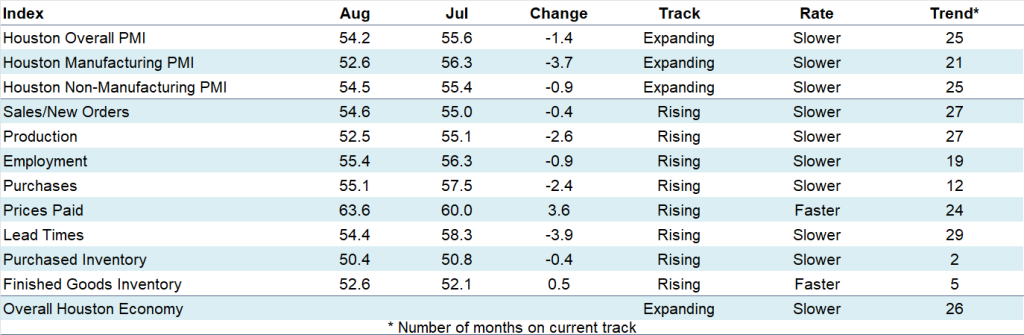
Houston PMI at 54.2 (down 1.4 points)
Sales/New Orders at 54.6 (down 0.4 points)
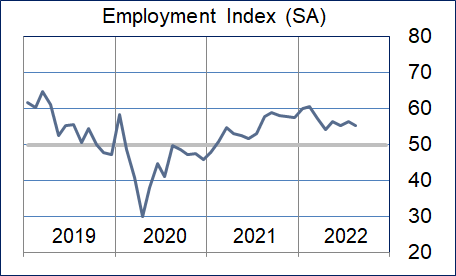
Employment at 55.4 (down 0.9 points)
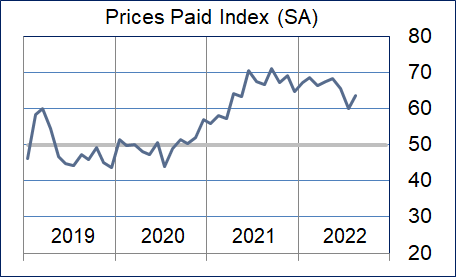
Prices Paid at 63.6 (up 3.6 points)
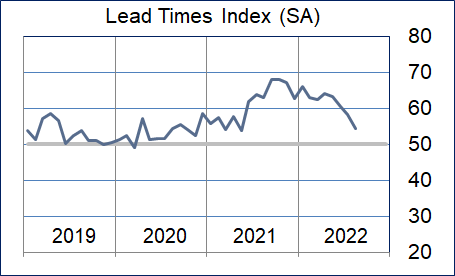
Lead Times at 54.4 (down 3.9 points)
Finished Goods Inventories at 52.6 (up 0.5 points)
(Houston, Texas) – According to Houston area supply chain executives, economic activity in Houston expanded at a moderately slower pace in August led by slower expansion in the manufacturing sectors. Non-manufacturing activities showed a minimally higher expansion rate.
The Houston Purchasing Managers Index fell 1.4 points to 54.2. This fall was the result of lower lead times, sales/new orders, and employment indices. The finished goods inventory index rose minimally. The first three of these indicators have the strongest direct correlation with economic activity in Houston. The sales/new orders index fell 0.4 points to 54.6, the employment index fell 0.9 points to 55.4, and the lead times index fell 3.9 points to 54.4. The Finished goods inventory index, the underlying indicator that has the strongest inverse correlation with economic activity, rose 0.5 points to 52.6, continuing to give a modest indication of contraction.
As noted earlier this year, ISM-Houston is now reporting separate indices for manufacturing and non-manufacturing industries in addition to the overall Houston Purchasing Managers Index. The HPMI forecast has been eliminated from this report. The Houston Manufacturing PMI fell 3.7 points to 52.6., pointing to slower expansion. The non-manufacturing PMI fell 0.9 points to 54.5 showing modestly lower expansion for the industries in this sector.
On an industry specific basis, construction, leisure and hospitality, health care, professional and management services, transportation, trade, and warehousing reported strong expansion. Oil & gas, manufacturing, and real estate reported very modest expansion.
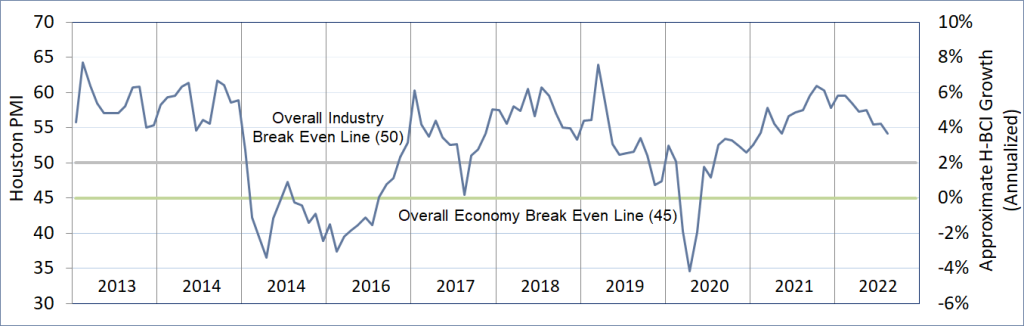
The Houston PMI provides a measure of current economic activity in the greater Houston area and a forecast of likely shifts in activity over a three-month forecast horizon. These indicators have a possible range of 0 to 100. Readings over 50 generally indicate goods producing industry expansion; readings below 50 show contraction. A PMI above 45 generally correlates with expansion of the Houston-The Woodlands-Sugar Land Business Cycle Index. The current and forecast PMI indices are based on diffusion indices for eight underlying indicators: Sales/New Orders, Production, Employment, Purchases, Prices Paid, Lead Times, Purchase Inventory, and Finished Goods Inventory.
Click here for the hard copy version of the report.
Indices at a Glance
Houston PMI Trend
Houston PMI readings over 50 generally indicate that respondents see their activities as expanding. An HPMI above 45 normally correlates with expansion of the Houston-The Woodlands-Sugar Land Business Cycle Index (H-BCI).
Commodities Reported to have Notable Price Changes or to be in Short Supply
Up in Price: Professional services, general and rig labor; large irons for MRI and CT equipment; oil country tubular goods (OCTG), rigs; natural gas; salt, chlorine, caustic soda, ammonia, propylene glycol, triethylene glycol; high nickel alloy steels, electrical equipment/gear, some mechanical equipment, roofing materials, insulation, packaging (cardboard), furniture; computer software and hardware; truck, marine, and ocean‡ freight
Down in Price: Crude oil, gasoline, diesel, natural gas; butadiene, ethylene dichloride, benzene, toluene, xylene, styrene; carbon steel, copper wire & cable, nickel components, electrical bulks, electrical equipment, glass fiber, lumber; rail and ocean‡ freight
In Short Supply: Professional, technical, senior consulting, rig and light industrial labor; lab supplies, IV fluids; oil country tubular goods (OCTG), rigs, drilling chemicals; salt, liquid caustic soda, phosphoric acid, ethylene dichloride, triethylene glycol, pigments, rubber compounds, PFA; high yield steel, electrical gear, mechanical equipment, generators, roofing materials, fabricated millwork, cement/concrete; electronics, computer hardware, semiconductor chips; truck transportation
‡ reported as up or down by different respondents
What our Respondents are Saying
Oil and Gas Exploration, and Key Support Services:
- General flattening on key commodity prices and security of supply is a bit more predictable
- While the market for computer hardware is still tight, it is getting better
- Expansion in this sector is slowing with most underlying indicators pointing to expansion at a slower pace; the lead times indicator fell well below neutral
Construction:
- The shortage of labor in the US continues to be a challenge across industries
- This sector showed continued expansion with the purchases index joining the employment, prices paid, and lead times indices being reported above neutral
Durable Goods Manufacturing:
- Our company expects business productivity and sales growth to continue in the coming months as our products are tied to the demand for Oil & Gas exploration and production
- Factors such as inflation, material shortages, and extended lead times remain a challenge, but we have successfully mitigated these challenges through proper inventory planning and supplier diversification
- This sector reported modestly slower expansion with the sales/new orders ,purchases, prices paid indices showing considerable strength; the lead times index fell noticeably, but remained well above neutral
Non-durable Goods Manufacturing:
- Anticipate a softer market for the next 12 to 18 months
- This sector’s overall performance fell to near neutral with nearly all indicators reporting just above neutral; the prices paid index remained high
Trade, Transportation, and Warehousing:
- Support for capital spending on renewables and downstream maintenance is driving spend and revenue
- Watching lead times, freight increases, superfund tax, refinery/chemical plant turnarounds, weather, oil/gas prices
- Demand is increasing but ever changing; automotive is flat; medical, metals, and agricultural nutrients remain strong
- This sector remained above neutral with the sales/new orders, production, purchases, prices paid, and lead times indices remaining well above neutral; the employment index fell to near neutral
Real-Estate Services:
- Demand for new homes has slowed and we have lowered our expectations for new starts through the end of the year
- This sector’s overall performance and most of the underlying indicators came in just above neutral with only the prices paid and lead times indicators showing considerable strength; industrial and apartment related real-estate continues to expand, while housing and office real-estate are contracting at a slow pace
Professional and Business Services:
- The soft market of last year no longer exists and people are very choosey regarding job opportunities
- Salaries and hourly pay rates are relatively stable, however, we see upward pressure over the coming months
- Actual employment levels remained flat as there continues to be an abundance of jobs available but a shortage of candidates to fill those jobs across professional/technical job categories and light industrial job categories
- Oil price volatility is once again creating concern about hiring direct employees within O&G companies
- We see higher focus in medium and large corporations on investing in the maturity of their supply chains
- This sector strengthened minimally during the month; the employment and purchases indices showed strength while all other indicators came in near neutral
Leisure and Hospitality:
- This sector continues to expand at a very slow rate; only the prices paid and lead times indicators reported strength
Health Care:
- We are seeing insurance companies pushing people away from expensive hospital and acute space down the continuum of care to ambulatory surgery centers and physician clinics
- We are experiencing significant price increases due to additional fees, freight and other surcharges
- This sector moderated during the month but is still reporting strong expansion; all positively correlated indicators reported strong expansion
Trend of Underlying Indicators
The Houston PMI is based on diffusion indices for eight underlying indicators. The net value of each indicator is simply the percentage of respondents who cite a positive shift from the previous month minus the percentage who cite a negative shift. The diffusion index is calculated based on the percent of respondents reporting higher results plus one-half of those responding the same with a seasonal adjustment based on an X13 ARIMA forecast. Values above 50 for Sales/New Orders, Production, Employment, Prices Paid, and Lead Times generally point towards expansion and values below 50 signal contraction. Note that the Prices Paid Index may not follow this trend late in an economic expansion. The Inventory measures have an inverse correlation at most forecast horizons, meaning that values below 50 point to expansion and values above point to contraction. The Purchases index is inversely correlated with economic activity at the three-month forecast horizon.
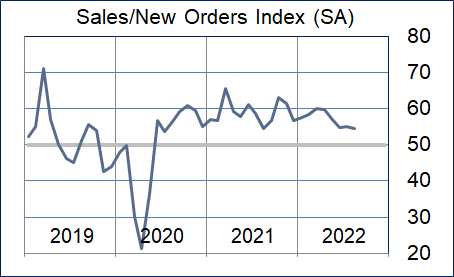
Sales/New Orders
The sales/new orders index fell minimally with manufacturing activities reporting just lower than last month. Non-manufacturing activities expanded at a similar rate to last month.
| Higher | Same | Lower | Net | Index | |
| Mar/22 | 22% | 77% | 1% | 21% | 60.0 |
| Apr/22 | 24% | 75% | 1% | 23% | 59.7 |
| May/22 | 21% | 77% | 2% | 19% | 57.4 |
| Jun/22 | 14% | 82% | 4% | 10% | 54.8 |
| Jul/22 | 15% | 81% | 4% | 11% | 55.0 |
| Aug/22 | 14% | 82% | 4% | 10% | 54.6 |
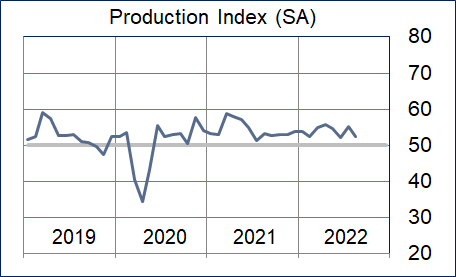
Production Index
The production index fell modestly with both durable and nondurable goods manufacturing falling to near neutral. Nonmanufacturing industries that report production also fell to near neutral.
| Higher | Same | Lower | Net | Index | |
| Mar/22 | 11% | 88% | 1% | 10% | 54.8 |
| Apr/22 | 13% | 86% | 1% | 12% | 55.6 |
| May/22 | 12% | 87% | 1% | 11% | 54.6 |
| Jun/22 | 7% | 91% | 2% | 5% | 52.0 |
| Jul/22 | 13% | 84% | 3% | 10% | 55.1 |
| Aug/22 | 10% | 85% | 5% | 5% | 52.5 |
Employment Index
The employment index fell marginally in both manufacturing and nonmanufacturing sectors. O&G, construction, transportation, professional services, and health care continue to report strength in this index.
| Mar/22 | 15% | 84% | 1% | 14% | 57.3 |
| Apr/22 | 15% | 83% | 2% | 13% | 54.1 |
| May/22 | 17% | 81% | 2% | 15% | 56.4 |
| Jun/22 | 15% | 84% | 1% | 14% | 55.3 |
| Jul/22 | 15% | 83% | 2% | 13% | 56.3 |
| Aug/22 | 14% | 84% | 2% | 12% | 55.4 |
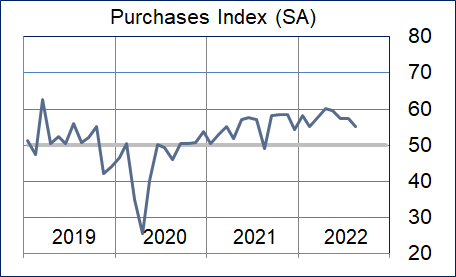
Purchases Index
The purchases index also fell marginally during the month. Most sectors reported this index as pointing to strong expansion. Nondurable goods manufacturing reported in a contracting.
| Mar/22 | 19% | 80% | 1% | 18% | 57.7 |
| Apr/22 | 22% | 77% | 1% | 21% | 60.1 |
| May/22 | 21% | 77% | 2% | 19% | 59.6 |
| Jun/22 | 19% | 79% | 2% | 17% | 57.4 |
| Jul/22 | 17% | 79% | 4% | 13% | 57.5 |
| Aug/22 | 19% | 74% | 7% | 12% | 55.1 |
Prices Paid Index
The prices paid index rose during the month after several months of decline. Significantly fewer commodities were reported as down in price during the month.
| Higher | Same | Lower | Net | Index | |
| Mar/22 | 38% | 61% | 1% | 37% | 66.4 |
| Apr/22 | 41% | 58% | 1% | 40% | 67.4 |
| May/22 | 41% | 58% | 1% | 40% | 68.4 |
| Jun/22 | 33% | 65% | 2% | 31% | 65.7 |
| Jul/22 | 24% | 69% | 7% | 17% | 60.0 |
| Aug/22 | 29% | 67% | 4% | 25% | 63.6 |
Lead Times Index
The lead times fell again this month ending at its lowest level in over a year. Construction, durable goods manufacturing, wholesale trade and health care reported very high lead times indices while O&G reported contraction.
| Mar/22 | 31% | 64% | 5% | 26% | 62.4 |
| Apr/22 | 36% | 61% | 3% | 33% | 64.0 |
| May/22 | 33% | 63% | 4% | 29% | 63.4 |
| Jun/22 | 26% | 70% | 4% | 22% | 60.4 |
| Jul/22 | 22% | 73% | 5% | 17% | 58.3 |
| Aug/22 | 17% | 76% | 7% | 10% | 54.4 |
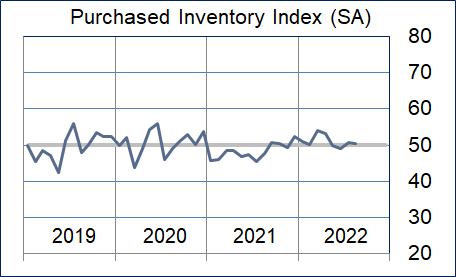
Purchased Inventory Index
The purchased inventory index fell minimally. Health care and durable goods manufacturing reported these inventories as expanding at a rapid pace. Nondurable goods manufacturing and wholesale trade reported them as contracting.
| Higher | Same | Lower | Net | Index | |
| Mar/22 | 11% | 88% | 1% | 10% | 54.1 |
| Apr/22 | 10% | 88% | 2% | 8% | 53.3 |
| May/22 | 6% | 92% | 2% | 4% | 49.7 |
| Jun/22 | 7% | 86% | 7% | 0% | 49.1 |
| Jul/22 | 9% | 85% | 6% | 3% | 50.8 |
| Aug/22 | 9% | 84% | 7% | 2% | 50.4 |
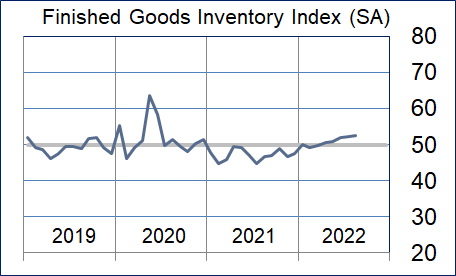
Finished Goods Inventory Index
The finished goods inventory index rose modestly. Durable goods manufacturing reported this index as expanding at a rapid pace again this month. Nondurable goods reported it as contracting.
| Higher | Same | Lower | Net | Index | |
| Mar/22 | 5% | 89% | 6% | -1% | 49.9 |
| Apr/22 | 6% | 91% | 3% | 3% | 50.5 |
| May/22 | 5% | 91% | 4% | 1% | 50.8 |
| Jun/22 | 5% | 92% | 3% | 2% | 51.9 |
| Jul/22 | 8% | 88% | 4% | 4% | 52.1 |
| Aug/22 | 9% | 86% | 5% | 4% | 52.6 |
Background on the ISM-Houston Business Report and HPMI Calculation Methods
The Houston Purchasing Managers Index has been included as an integral part of the ISM-Houston Business Report since the Houston chapter of the Institute for Supply Management started publication of this document in January 1995. The report and index are published monthly as the primary deliverables from a survey of Houston area Supply Chain leaders regarding the status of key activities believed to provide insight into the strength of the economy. The respondents come from diverse organizations including construction, energy, engineering, health care, durable and non-durable goods manufacturing, financial and business services, wholesale and retail trade, and utilities related companies.
The Houston Purchasing Managers Index is determined from diffusion indices of the eight indicators of economic activity covered by the ISM-Houston Business Survey and Report. These underlying indicators are sales or new orders, production, employment, purchases, prices paid for major purchases, lead times from sellers, purchased materials inventory (raw materials and supplies), and finished goods inventories. The respondents to the survey report the direction of each these activities as either up, the same or down in comparison to the previous month. An index for each of these areas is then calculated by subtracting the percentage of respondents that sight a negative shift from the percentage that sight a positive shift. For indicators that are positively correlated with economic growth, this results in an underlying index that points to expansion when it is above zero. Indicators that are negatively correlated with growth point to expansion when they are below zero.
The final Houston PMI is calculated by applying optimal regression factors to each of the eight underlying indicators noted above. These regression factors are determined using standard regression techniques comparing these underlying indicators to the Houston-The Woodlands-Sugar Land Business Cycle Index (Houston BCI), which is reported on a monthly basis by the Federal Reserve Bank of Dallas. This top-level index is converted to a 0 to 100 scale to match that of the national Purchasing Managers Index® (PMI®) which is published monthly by the Institute for Supply Management® (ISM®). Readings over 50 for the HPMI generally indicate manufacturing expansion in the Houston in the near term and readings below 50 show coming manufacturing contraction.
It is important to note that the manufacturing breakeven HPMI does not equate to the breakeven point for the overall Houston economy. ISM-Houston periodically reviews the capability of its correlations and adjusts the regression factors when appropriate. The most recent revision occurred as a result of a review undertaken during the third quarter of 2018, which determined that changes in the Houston economy over the last decade have shifted the intercept of the correlation, causing a neutral Houston PMI to no longer align with a neutral Houston BCI. A Houston PMI of 45 points now equates to a neutral Houston economy as measured by the Houston BCI. A similar offset between the National PMI and the National economy has existed for some time.
Use of ISM-Houston Business Report Content
All information contained in this report is protected by copyright laws and ISM-Houston retains all rights to this Content. ISM-Houston hereby grants you a limited, revocable license to access, print, and display this Content solely for your personal, non-commercial use. Requests for permission to reproduce or redistribute ISM-Houston Business Report Content can be made by contacting the ISM-Houston Business Survey Committee at hpmi@ism-houston.org.
ISM-Houston shall not have any liability, duty, or obligation for or relating to the ISM-Houston Business Report Content or other information contained herein, any errors, inaccuracies, omissions or delays in providing any ISM-Houston Business Report Content, or for any actions taken in reliance thereon. In no event shall ISM-Houston be liable for any special, incidental, or consequential damages, arising out of the use of the ISM-Houston Business Report.