
For release May 10, 2023
April ISM-Houston Business Report
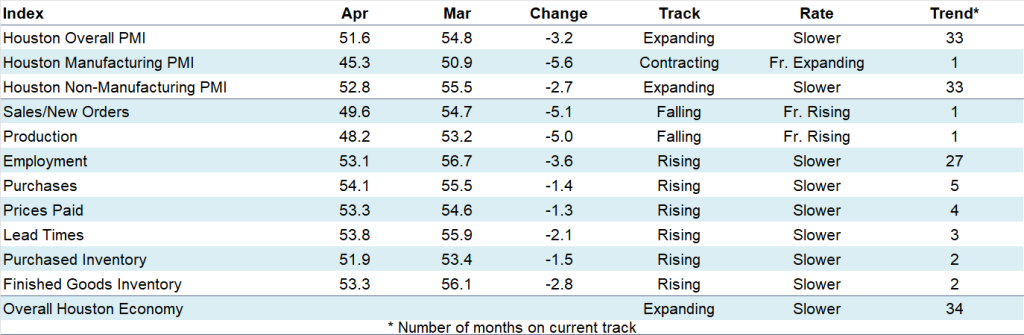
Houston PMI at 51.6 (down 3.2 points)
Sales/New Orders Contracting
Production Contracting
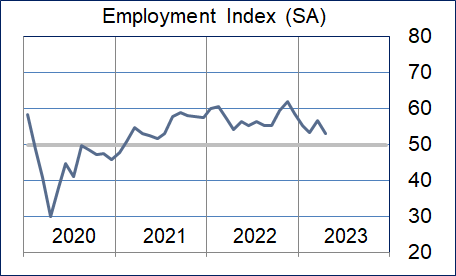
Employment Expanding
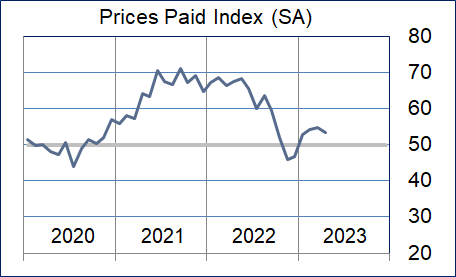
Prices Paid Expanding
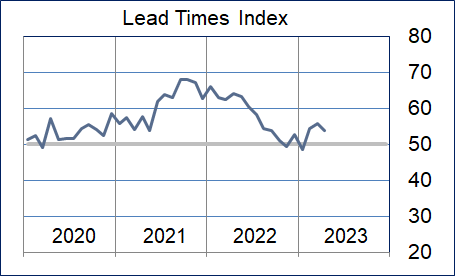
Lead Times Expanding
Finished Goods Inventories Expanding
(Houston, Texas) – According to Houston area supply chain executives, economic activity in Houston expanded at a significantly slower pace in April. Manufacturing sector activity reported a significant rate of contraction while nonmanufacturing activity showed continued expansion at a much slower rate.
The Houston Purchasing Managers Index fell 3.2 points to 51.6. Two of the three underlying indicators that have the strongest correlation with the Houston economy (employment and lead times) continue pointing to modest economic expansion. The third (sales/new orders) is now pointing to very slow economic contraction. The employment index fell 3.6 points to 53.1 and the lead times index fell 2.1 points to 53.8. The sales/new orders index fell 5.1 points to 49.6, The finished goods inventory index, the underlying indicator that has the strongest inverse correlation with economic activity, fell 2.8 points to 53.3, giving a modest signal of potential economic contraction.
The Houston Manufacturing PMI fell 5.6 points to 45.3, providing a strong indication of potential overall economic contraction. The nonmanufacturing PMI fell 2.7 points to 52.8, showing a lower expansion rate for the industries in this sector.
On an industry specific basis, oil & gas, professional and management services, health care, and construction reported strong expansion. Trade, transportation & warehousing reported very modest expansion. Manufacturing, leisure and hospitality, and real estate reported low to moderate contraction.
The Houston PMI provides a measure of current economic activity in the greater Houston area and a forecast of likely shifts in activity over a three-month forecast horizon. These indicators have a possible range of 0 to 100. Readings over 50 generally indicate goods producing industry expansion; readings below 50 show contraction. A PMI above 45 generally correlates with expansion of the Houston-The Woodlands-Sugar Land Business Cycle Index. The current and forecast PMI indices are based on diffusion indices for eight underlying indicators: Sales/New Orders, Production, Employment, Purchases, Prices Paid, Lead Times, Purchase Inventory, and Finished Goods Inventory.
The Houston PMI provides a measure of current economic activity in the greater Houston area and a forecast of likely shifts in activity over a three-month forecast horizon. These indicators have a possible range of 0 to 100. Readings over 50 generally indicate goods producing industry expansion; readings below 50 show contraction. A PMI above 45 generally correlates with expansion of the Houston-The Woodlands-Sugar Land Business Cycle Index. The current and forecast PMI indices are based on diffusion indices for eight underlying indicators: Sales/New Orders, Production, Employment, Purchases, Prices Paid, Lead Times, Purchase Inventory, and Finished Goods Inventory.
Click here to see the PDF version of the full report.
Indices at a Glance
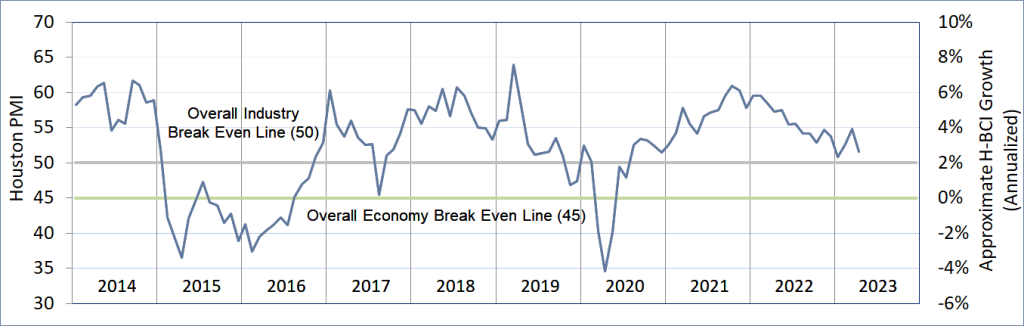
Houston PMI Trend
Houston PMI readings over 50 generally indicate that respondents see their activities as expanding. An HPMI above 45 normally correlates with expansion of the Houston-The Woodlands-Sugar Land Business Cycle Index (H-BCI).
Commodities Reported to have Notable Price Changes or to be in Short Supply
Up in Price: Light industrial labor, oil field labor; crude oil; oil country tubular goods (OCTG); elastomers; mechanical seals; silver, platinum, palladium, magnesium; specialty alloy plate, electrical gear and components, electrical wire and cable, electrical houses, switchgear, transformers, construction supplies; used equipment and vehicles; containerized freight from China
Down in Price: Electricity, diesel fuel, jet fuel, natural gas; ethane, ethylene, propylene, polyethylene and polypropylene resins; rhodium, molybdenum; carbon steel piping and plate; motors
In Short Supply: Rig and oil field services labor, senior consultants, light industrial labor; offshore fabrication yards; fluoropolymers (PFAs); gear pumps, furnace coils, low temperature/high yield piping materials; electrical gear, electrical subcomponents, power supplies, generators, electrical houses, switchgear, transformers, elevators, HVAC equipment and components; construction supplies; vehicles
‡ reported as up or down by different respondents
What our Respondents are Saying
Oil and Gas Exploration, and Key Support Services:
- While inflation is still present, the rate of change is leveling off
- There is significant competition for piping fabrication resources
- This sector saw continued growth at a somewhat slower pace with all underlying indices pointing to further expansion
Construction:
- We are not seeing anything in short supply, but lead times remain challenged
- Lead times for transformers and switchgear have increased dramatically (2-3 years)
- Performance in this sector stayed well above neutral with the employment, prices paid, and lead times indices reporting continued strength; the sales/new orders index fell to near neutral
Durable Goods Manufacturing:
- This sector’s performance fell back below neutral with the sales/new orders, purchases and inventory indices pointing to significant economic contraction; the production and employment indices showed strength
Non-durable Goods Manufacturing:
- Easing supply chain but our order backlog remains high; quality labor availability continues to be a challenge
- Tire and housing materials are in a slowdown
- Cracking feedstock and olefins product prices started falling late in the month
- This sector’s performance fell to well below neutral with the sales/new orders, production, employment, and purchases indices all reported as contracting; the prices paid index fell to neutral while the lead time index
Trade, Transportation, and Warehousing:
- This sector’s performance remained near neutral with all indices at or just above this level
Real-Estate Services:
- This sector fell modestly below neutral with housing, industrial, and retail real estate all at this level
Leisure and Hospitality:
- This sector’s performance remained near neutral during the month with all indices reporting at this level
Professional and Business Services:
- Rising interest rates and inflationary concerns continue to impact hiring of employees and contractors as company leadership concerns over a recession remain in play
- We don’t see a shortage in any discipline and hourly or direct hire compensation amounts remain unchanged
- Demand and Supply are constant with salaries and hourly rates remaining flat, but higher than this time last year
- There are people “willing” to change companies for higher compensation and better life/work balance improvement which basically means a good mixture of office and remote working conditions
- Our clients continue to look closely at their people needs and some are pulling the trigger to expand staff, but those increasing staff are being conservative and cautious; a definite need by a company will be addressed but adding staff remains something that is under intense review for approval
- We see higher focus of large corporations for investing on the maturity of their supply chain
- This sector continues to report strong expansion with strength in the sales/new orders, employment, purchases, and lead times indices
Health Care:
- Large ticket construction items continue to have long lead time
- Government reimbursement on Medicare has fallen significantly taking billions in revenue out of the industry; we are already seeing hiring freezes and other cost cutting measures; pricing will be at the forefront of everything going forward which will clash with inflation and interest rates
- This sector moderated during the month but remained well above neutral; the sales/new orders and purchases indices fell to neutral while the employment, prices paid, and lead times indices remained strong
Government:
- Hiring qualified staff is still an issue
- The ability to fulfill orders for vehicles is a challenge
- Construction costs are still increasing causing projects to be reduced in scope
- This sector’s performance remains near neutral with only the purchases index showing strength
Trend of Underlying Indicators
The Houston PMI is based on diffusion indices for eight underlying indicators. The net value of each indicator is simply the percentage of respondents who cite a positive shift from the previous month minus the percentage who cite a negative shift. The diffusion index is calculated based on the percent of respondents reporting higher results plus one-half of those responding the same with seasonal adjustments to the Sales/New Orders, Production, Employment, and Prices Paid indices based on an X13 ARIMA forecast. Values above 50 for Sales/New Orders, Production, Employment, Prices Paid, and Lead Times generally point towards expansion and values below 50 signal contraction. Note that the Prices Paid Index may not follow this trend late in an economic expansion. The Inventory measures have an inverse correlation at most forecast horizons, meaning that values below 50 point to expansion and values above point to contraction. The Purchases index is inversely correlated with economic activity at the three-month forecast horizon.
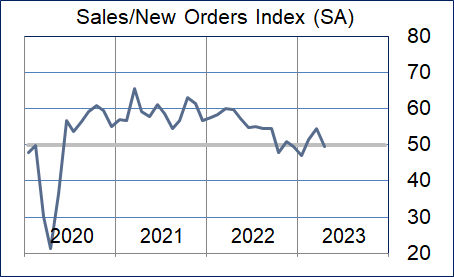
Sales/New Orders
The sales/new orders index fell back below neutral with significant reductions in this index for both the nonmanufacturing and manufacturing sectors. Manufacturing ended well below neutral.
| Higher | Same | Lower | Net | Index | |
| Nov/22 | 14% | 70% | 16% | -2% | 51.1 |
| Dec/22 | 8% | 78% | 14% | -6% | 49.5 |
| Jan/23 | 7% | 85% | 8% | -1% | 47.2 |
| Feb/23 | 10% | 85% | 5% | 5% | 51.4 |
| Mar/23 | 17% | 76% | 7% | 10% | 54.7 |
| Apr/23 | 12% | 81% | 7% | 5% | 49.6 |
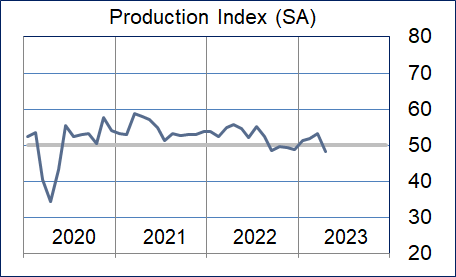
Production Index
The production index also fell back below neutral. As with the sales/new orders index, both nonmanufacturing and manufacturing indicated contraction in this area.
| Higher | Same | Lower | Net | Index | |
| Nov/22 | 8% | 82% | 10% | -2% | 49.3 |
| Dec/22 | 5% | 84% | 11% | -6% | 48.8 |
| Jan/23 | 9% | 84% | 7% | 2% | 51.3 |
| Feb/23 | 9% | 86% | 5% | 4% | 51.8 |
| Mar/23 | 13% | 80% | 7% | 6% | 53.2 |
| Apr/23 | 9% | 85% | 6% | 3% | 48.2 |
Employment Index
This index rose modestly this month with nonmanufacturing reporting somewhat slower growth and manufacturing indicating significant contraction. Durable goods reported expansion while nondurable goods showed contraction.
| Higher | Same | Lower | Net | Index | |
| Nov/22 | 23% | 74% | 3% | 20% | 61.9 |
| Dec/22 | 16% | 81% | 3% | 13% | 58.6 |
| Jan/23 | 14% | 86% | 0% | 14% | 55.3 |
| Feb/23 | 13% | 81% | 6% | 7% | 53.2 |
| Mar/23 | 23% | 69% | 8% | 15% | 56.7 |
| Apr/23 | 18% | 78% | 4% | 14% | 53.1 |
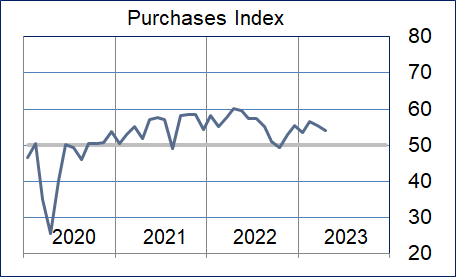
Purchases Index
The purchases index was reported as rising at a somewhat slower pace to last month. Manufacturing reported significant contraction in this index while nonmanufacturing purchases expanded at a moderately higher rate.
| Higher | Same | Lower | Net | Index | |
| Nov/22 | 14% | 77% | 9% | 5% | 53.0 |
| Dec/22 | 13% | 77% | 10% | 3% | 55.3 |
| Jan/23 | 10% | 87% | 3% | 7% | 53.4 |
| Feb/23 | 15% | 83% | 2% | 13% | 56.5 |
| Mar/23 | 16% | 79% | 5% | 11% | 55.5 |
| Apr/23 | 17% | 74% | 9% | 8% | 54.1 |
Prices Paid Index
The prices paid index pointed to expansion at a somewhat slower rate. Nonmanufacturing reported expansion at a similar rate to last month while manufacturing fell back to indicating modest contraction.
| Higher | Same | Lower | Net | Index | |
| Nov/22 | 12% | 67% | 21% | -9% | 45.9 |
| Dec/22 | 7% | 76% | 17% | -10% | 46.7 |
| Jan/23 | 7% | 91% | 2% | 5% | 52.9 |
| Feb/23 | 16% | 81% | 3% | 13% | 54.3 |
| Mar/23 | 24% | 69% | 7% | 17% | 54.6 |
| Apr/23 | 11% | 85% | 4% | 7% | 53.3 |
Lead Times Index
The lead times index fell modestly with both nonmanufacturing and manufacturing reporting a slower rate of expansion.
| Higher | Same | Lower | Net | Index | |
| Nov/22 | 9% | 80% | 11% | -2% | 49.3 |
| Dec/22 | 11% | 81% | 8% | 3% | 52.7 |
| Jan/23 | 4% | 89% | 7% | -3% | 48.7 |
| Feb/23 | 13% | 82% | 5% | 8% | 54.4 |
| Mar/23 | 20% | 71% | 9% | 11% | 55.9 |
| Apr/23 | 12% | 83% | 5% | 7% | 53.8 |
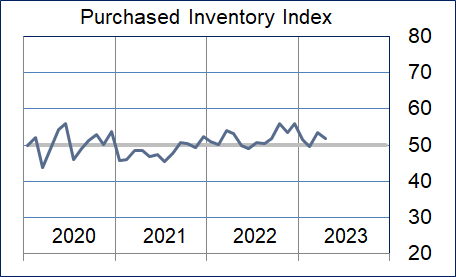
Purchased Inventory Index
The purchased inventory index fell modestly indicating minimally slower expansion. Manufacturing reported a much higher expansion rate for this index while nonmanufacturing reported near neutral.
| Higher | Same | Lower | Net | Index | |
| Nov/22 | 9% | 86% | 5% | 4% | 53.5 |
| Dec/22 | 7% | 90% | 3% | 4% | 55.9 |
| Jan/23 | 4% | 95% | 1% | 3% | 51.5 |
| Feb/23 | 6% | 88% | 6% | 0% | 49.6 |
| Mar/23 | 10% | 86% | 4% | 6% | 53.4 |
| Apr/23 | 12% | 79% | 9% | 3% | 51.9 |
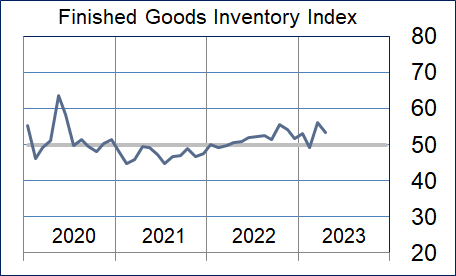
Finished Goods Inventory Index
The finished goods inventory index was reported as expanding at a slower pace with both the nonmanufacturing and manufacturing sectors continuing to report expansion of this index.
| Higher | Same | Lower | Net | Index | |
| Nov/22 | 14% | 82% | 4% | 10% | 54.1 |
| Dec/22 | 10% | 85% | 5% | 5% | 51.6 |
| Jan/23 | 6% | 94% | 0% | 6% | 53.0 |
| Feb/23 | 5% | 89% | 6% | -1% | 49.1 |
| Mar/23 | 16% | 80% | 4% | 12% | 56.1 |
| Apr/23 | 11% | 85% | 4% | 7% | 53.3 |
Background on the ISM-Houston Business Report and HPMI Calculation Methods
The Houston Purchasing Managers Index has been included as an integral part of the ISM-Houston Business Report since the Houston chapter of the Institute for Supply Management started publication of this document in January 1995. The report and index are published monthly as the primary deliverables from a survey of Houston area Supply Chain leaders regarding the status of key activities believed to provide insight into the strength of the economy. The respondents come from diverse organizations including construction, energy, engineering, health care, durable and non-durable goods manufacturing, financial and business services, wholesale and retail trade, and utilities related companies.
The Houston Purchasing Managers Index is determined from diffusion indices of the eight indicators of economic activity covered by the ISM-Houston Business Survey and Report. These underlying indicators are sales or new orders, production, employment, purchases, prices paid for major purchases, lead times from sellers, purchased materials inventory (raw materials and supplies), and finished goods inventories. The respondents to the survey report the direction of each these activities as either up, the same or down in comparison to the previous month. An index for each of these areas is then calculated by subtracting the percentage of respondents that sight a negative shift from the percentage that sight a positive shift. For indicators that are positively correlated with economic growth, this results in an underlying index that points to expansion when it is above zero. Indicators that are negatively correlated with growth point to expansion when they are below zero.
The final Houston PMI is calculated by applying optimal regression factors to each of the eight underlying indicators noted above. These regression factors are determined using standard regression techniques comparing these underlying indicators to the Houston-The Woodlands-Sugar Land Business Cycle Index (Houston BCI), which is reported on a monthly basis by the Federal Reserve Bank of Dallas. This top-level index is converted to a 0 to 100 scale to match that of the national Purchasing Managers Index® (PMI®) which is published monthly by the Institute for Supply Management® (ISM®). Readings over 50 for the HPMI generally indicate manufacturing expansion in the Houston in the near term and readings below 50 show coming manufacturing contraction.
It is important to note that the manufacturing breakeven HPMI does not equate to the breakeven point for the overall Houston economy. ISM-Houston periodically reviews the capability of its correlations and adjusts the regression factors when appropriate. The most recent revision occurred as a result of a review undertaken during the third quarter of 2018, which determined that changes in the Houston economy over the last decade have shifted the intercept of the correlation, causing a neutral Houston PMI to no longer align with a neutral Houston BCI. A Houston PMI of 45 points now equates to a neutral Houston economy as measured by the Houston BCI. A similar offset between the National PMI and the National economy has existed for some time.
Use of ISM-Houston Business Report Content
All information contained in this report is protected by copyright laws and ISM-Houston retains all rights to this Content. ISM-Houston hereby grants you a limited, revocable license to access, print, and display this Content solely for your personal, non-commercial use. Requests for permission to reproduce or redistribute ISM-Houston Business Report Content can be made by contacting the ISM-Houston Business Survey Committee at hpmi@ism-houston.org.
ISM-Houston shall not have any liability, duty, or obligation for or relating to the ISM-Houston Business Report Content or other information contained herein, any errors, inaccuracies, omissions or delays in providing any ISM-Houston Business Report Content, or for any actions taken in reliance thereon. In no event shall ISM-Houston be liable for any special, incidental, or consequential damages, arising out of the use of the ISM-Houston Business Report.