
For release May 10, 2022
April 2022 ISM-Houston Business Report
Houston PMI at 57.3
Sales/New Orders at 59.7
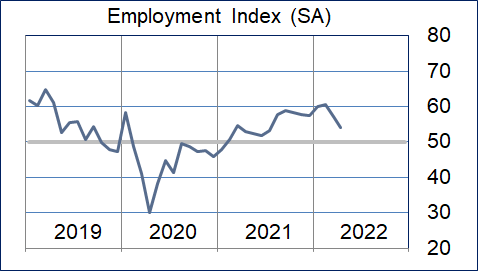
Employment at 54.1
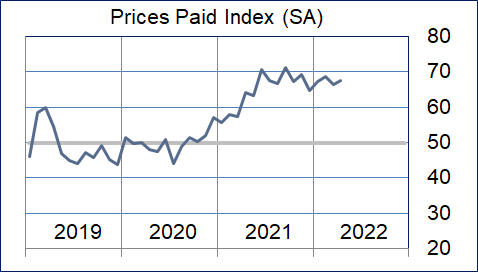
Prices Paid at 67.4
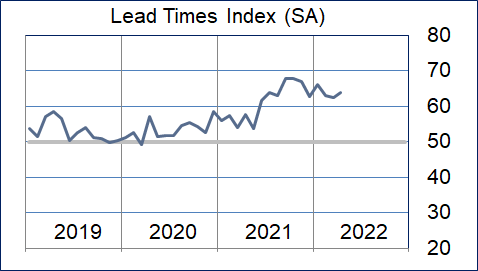
Lead Times at 64.0
Finished Goods Inventories at 50.5
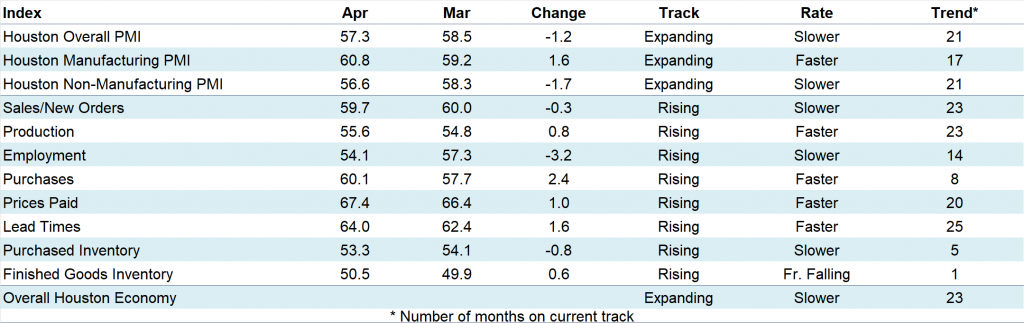
(Houston, Texas) – According to Houston area supply chain executives, economic activity in Houston expanded in April at a moderately slower rate than March. The ISM-Houston PMI diffusion index fell minimally. Non-manufacturing activities expanded at modestly slower rate to than month, while manufacturing activities expanded at a somewhat higher pace.
The Houston Purchasing Managers Index fell 1.2 points to 57.3. This was driven by lower sales/new orders and employment indices offset somewhat by a higher lead times index. These indicators have the strongest direct correlation with economic activity in Houston. The sales/new orders index fell 0.3 points to 59.7, the employment index fell 3.2 points to 54.1, and the lead times index rose 1.6 points to 64.0. The Finished goods inventory index, the underlying indicator that has the strongest inverse correlation with economic activity, rose 0.6 points to just above neutral at 50.5, giving a very small indication of contraction.
As noted earlier this year, ISM-Houston is now reporting separate indices for manufacturing and non-manufacturing industries in addition to the overall Houston Purchasing Managers Index. The HPMI forecast has been eliminated from this report. The Houston Manufacturing PMI rose 1.6 points to 60.8, indicate stronger expansion. The non-manufacturing PMI fell 1.7 points to 56.6 showing a lower rate of expansion for the industries in this sector.
On an industry specific basis, healthcare, construction, oil & gas extraction, professional and management services, manufacturing, and transportation, trade, and warehousing reported strong expansion. Leisure and hospitality, and real estate reported modest expansion.
Click here for the hard copy version of the report.
Indices at a Glance
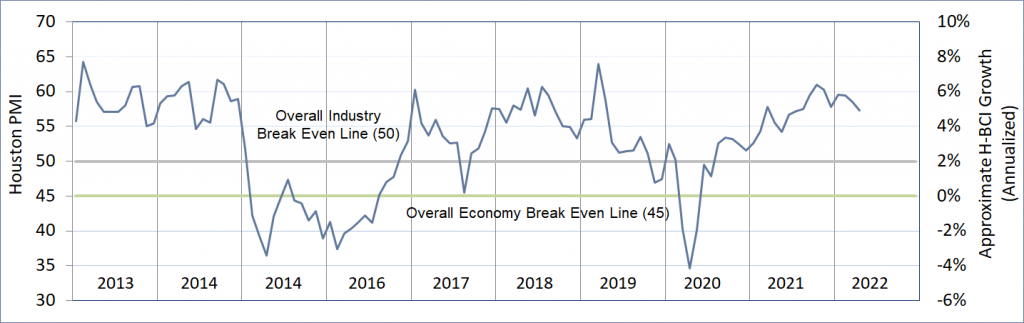
Houston PMI Trend
Houston PMI readings over 50 generally indicate that respondents see their activities as expanding. An HPMI above 45 normally correlates with expansion of the Houston-The Woodlands-Sugar Land Business Cycle Index (H-BCI).
Commodities Reported to have Notable Price Changes or to be in Short Supply
Up in Price: Medical and surgical supplies; skilled, unskilled and professional labor, engineering services; drilling rigs, oil country tubular goods (OCTG), oil field chemicals, sand; motor fuels, natural gas; ethane; rubber compounds, methanol‡, butadiene, MTBE; steel bar, steel castings, steel pipe, lined pipe, capital equipment, heat exchangers, boilers, electrical equipment, motors; packing materials, corrugated products; computer software and hardware, electronics, instrumentation
Down in Price: Crude oil, natural gas liquids, propane, butanes, pentanes, methanol‡, ethylene, propylene, PVC resins, precious metals for catalysts (gold, silver, platinum, palladium), industrial metals (aluminum, copper, nickel), carbon steel products, steel feedstocks (iron ore, nickel, magnesium), lumber, containerized ocean freight from Asia
In Short Supply: Paper for labels, baby formula products, sterile water; light and heavy industrial labor, rig labor, IT Professionals; drilling rigs, oil country tubular goods (OCTG), oil field chemicals, sand; propylene glycol, rubber compounds, textiles, silicon, sealants, coatings; steel; electrical equipment and components, control systems, computer hardware, semiconductors; ground transportation
‡ reported as up or down by different respondents
What our Respondents are Saying
Oil and Gas Exploration, and Key Support Services:
- Continued price inflation across almost all categories
- All areas of supply chain are increasingly under pressure
- This sector continued its strong performance with the production, employment, purchases, prices paid, and lead times indices remaining above neutral
Construction:
- This sector reported continued strong growth; the sales/new orders, employment, purchases, prices paid, and lead times indices continued to be reported well above neutral
Durable Goods Manufacturing:
- Surcharges are now being added to contract raw material pricing
- We anticipate greater sales and production over the course of the coming months
- This sector continued to report good growth with the sales/new orders, production, prices paid, lead times indices showing strength; the employment index stayed near neutral; the inventory indices were reported above neutral
Non-durable Goods Manufacturing:
- Lead times and prices will continue to increase during the second half of the year; we see potential market softening starting late in the first half of next year
- We are seeing significant softening in both precious and industrial metals pricing as we move into May
- Gulf coast refinery utilization rates are the highest they have been since the summer of 2019
- This sector continued to show strength with the sales/new orders, production, employment, purchases, prices paid, and lead times indices remaining well above neutral; the finished goods inventory index rose to end just below neutral
Trade, Transportation, and Warehousing:
- Airport passenger traffic continues to increase and is now at 85-90% of 2019 levels
- Loaded import container traffic continues to increase
- There is an increase in our piping fabrication customer activities
- This sector moderated somewhat but remained above neutral with all indices except employment reporting above neutral; the employment index fell below neutral
Real-Estate Services:
- Industrial vacancy rates have fallen to a level near those of late 2019
- We are not seeing declines in new or existing home prices
- This sector expanded at a moderately slower pace with the sales, prices paid, and lead times indices continuing to report above neutral; home, industrial, and apartment real estate reported strength while office real estate remained weak
Professional and Business Services:
- There continues to be a large gap between the supply and demand for talent across nearly all labor categories
- Amazing that our markets have strengthened so drastically since the beginning of the year
- Hiring up, capital projects are moving forward, and overall optimism is increasing
- This sector softened but remained well above neutral; the purchases index joined the sales/new orders, employment, prices paid, and lead times indices showing strength
Leisure and Hospitality:
- This sector moderated during the month with only the prices paid and lead times indicators reporting strength
Health Care:
- We expect to see shortages of medical and surgical supplies due to the shutdown of manufacturing facilities in Ukraine the sanctions imposed on Russia
- This sector regained strength during the month with the employment index joining the sales/new orders, purchases, prices paid, and lead times indices reporting well above neutral
Trend of Underlying Indicators
The Houston PMI is based on diffusion indices for eight underlying indicators. The net value of each indicator is simply the percentage of respondents who cite a positive shift from the previous month minus the percentage who cite a negative shift. The diffusion index is calculated based on the percent of respondents reporting higher results plus one-half of those responding the same with a seasonal adjustment based on an X13 ARIMA forecast. Values above 50 for Sales/New Orders, Production, Employment, Prices Paid, and Lead Times generally point towards expansion and values below 50 signal contraction. Note that the Prices Paid Index may not follow this trend late in an economic expansion. The Inventory measures have an inverse correlation at most forecast horizons, meaning that values below 50 point to expansion and values above point to contraction. The Purchases index is inversely correlated with economic activity at the three-month forecast horizon.
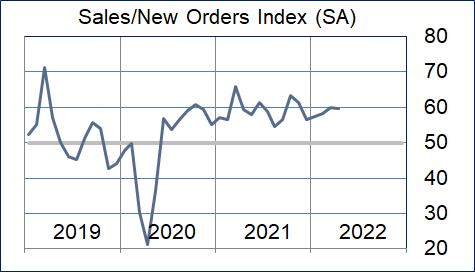
Sales/New Orders
The sales/new orders index fell minimally. Modest weakening in the services sector was mostly offset by improvements in manufacturing. Non-durable goods manufacturing showed significant improvement.
| Higher | Same | Lower | Net | Index | |
| Nov/21 | 17% | 82% | 1% | 16% | 61.4 |
| Dec/21 | 12% | 82% | 6% | 6% | 56.6 |
| Jan/22 | 18% | 80% | 2% | 16% | 57.5 |
| Feb/22 | 21% | 78% | 1% | 20% | 58.3 |
| Mar/22 | 22% | 77% | 1% | 21% | 60.0 |
| Apr/22 | 24% | 75% | 1% | 23% | 59.7 |
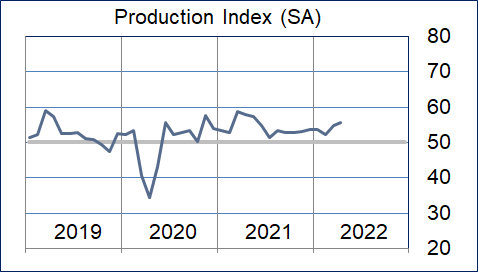
Production Index
The production index rose modestly again this month with O&G, durable goods manufacturing, and non-durable goods manufacturing continuing to show significant strength.
| Higher | Same | Lower | Net | Index | |
| Nov/21 | 7% | 92% | 1% | 6% | 53.0 |
| Dec/21 | 8% | 90% | 2% | 6% | 53.7 |
| Jan/22 | 10% | 89% | 1% | 9% | 53.7 |
| Feb/22 | 7% | 92% | 1% | 6% | 52.4 |
| Mar/22 | 11% | 88% | 1% | 10% | 54.8 |
| Apr/22 | 13% | 86% | 1% | 12% | 55.6 |
Employment Index
The employment index fell modestly. Health care joined oil and gas, construction, and professional and business services in reporting significant strength. Non-durable goods also strengthened while leisure and hospitality fell to neutral.
| Nov/21 | 20% | 74% | 6% | 14% | 57.7 |
| Dec/21 | 16% | 82% | 2% | 14% | 57.5 |
| Jan/22 | 18% | 81% | 1% | 17% | 59.9 |
| Feb/22 | 21% | 78% | 1% | 20% | 60.5 |
| Mar/22 | 15% | 84% | 1% | 14% | 57.3 |
| Apr/22 | 15% | 83% | 2% | 13% | 54.1 |
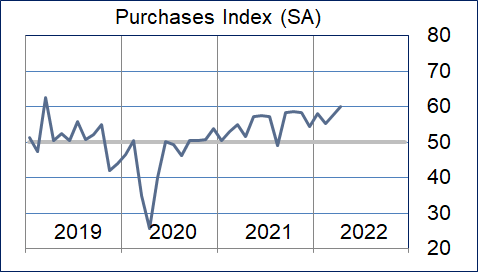
Purchases Index
The purchases index rose modestly. Manufacturing, health care, oil & gas, construction, trade, transportation, warehousing, and professional and business services reported strength in this index.
| Nov/21 | 16% | 82% | 2% | 14% | 58.4 |
| Dec/21 | 8% | 88% | 4% | 4% | 54.4 |
| Jan/22 | 20% | 79% | 1% | 19% | 58.1 |
| Feb/22 | 11% | 88% | 1% | 10% | 55.3 |
| Mar/22 | 19% | 80% | 1% | 18% | 57.7 |
| Apr/22 | 22% | 77% | 1% | 21% | 60.1 |
Prices Paid Index
The prices paid index rose minimally during the month. While most sectors continued to report this index as expanding at a rapid pace, many more commodities were listed as down in price when compared to the previous month.
| Higher | Same | Lower | Net | Index | |
| Nov/21 | 37% | 62% | 1% | 36% | 69.2 |
| Dec/21 | 26% | 72% | 2% | 24% | 64.7 |
| Jan/22 | 36% | 63% | 1% | 35% | 67.1 |
| Feb/22 | 39% | 60% | 1% | 38% | 68.7 |
| Mar/22 | 38% | 61% | 1% | 37% | 66.4 |
| Apr/22 | 41% | 58% | 1% | 40% | 67.4 |
Lead Times Index
The lead times index rose modestly during the month. Most sectors continue to report this index as expanding at a brisk pace.
| Nov/21 | 35% | 62% | 3% | 32% | 67.1 |
| Dec/21 | 26% | 70% | 4% | 22% | 62.8 |
| Jan/22 | 32% | 64% | 4% | 28% | 66.2 |
| Feb/22 | 31% | 65% | 4% | 27% | 62.9 |
| Mar/22 | 31% | 64% | 5% | 26% | 62.4 |
| Apr/22 | 36% | 61% | 3% | 33% | 64.0 |
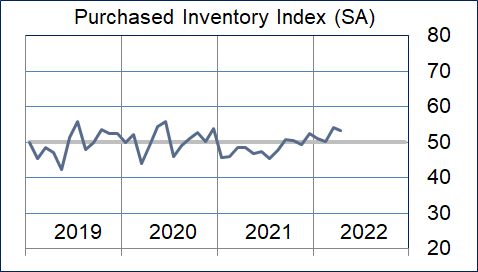
Purchased Inventory Index
The purchased inventory index fell minimally. Health care, durable goods, trade, transportation, and warehousing reported these inventories as expanding at a rapid pace. Nondurable goods reported them as contracting.
| Higher | Same | Lower | Net | Index | |
| Nov/21 | 2% | 95% | 3% | -1% | 49.3 |
| Dec/21 | 2% | 97% | 1% | 1% | 52.3 |
| Jan/22 | 9% | 90% | 1% | 8% | 51.1 |
| Feb/22 | 7% | 90% | 3% | 4% | 50.2 |
| Mar/22 | 11% | 88% | 1% | 10% | 54.1 |
| Apr/22 | 10% | 88% | 2% | 8% | 53.3 |
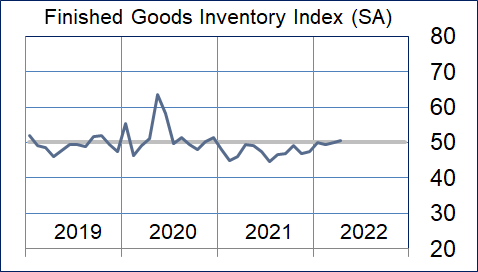
Finished Goods Inventory Index
The finished goods inventory index rose to just above neutral. Non-durable goods manufacturing continues to report in as contracting at a rapid pace. Durable goods, health care, and transportation and trade reported them as expanding.
| Higher | Same | Lower | Net | Index | |
| Nov/21 | 1% | 93% | 6% | -5% | 46.8 |
| Dec/21 | 1% | 95% | 4% | -3% | 47.5 |
| Jan/22 | 8% | 89% | 3% | 5% | 50.0 |
| Feb/22 | 6% | 89% | 5% | 1% | 49.3 |
| Mar/22 | 5% | 89% | 6% | -1% | 49.9 |
| Apr/22 | 6% | 91% | 3% | 3% | 50.5 |
Background on the ISM-Houston Business Report and HPMI Calculation Methods
The Houston Purchasing Managers Index has been included as an integral part of the ISM-Houston Business Report since the Houston chapter of the Institute for Supply Management started publication of this document in January 1995. The report and index are published monthly as the primary deliverables from a survey of Houston area Supply Chain leaders regarding the status of key activities believed to provide insight into the strength of the economy. The respondents come from diverse organizations including construction, energy, engineering, health care, durable and non-durable goods manufacturing, financial and business services, wholesale and retail trade, and utilities related companies.
The Houston Purchasing Managers Index is determined from diffusion indices of the eight indicators of economic activity covered by the ISM-Houston Business Survey and Report. These underlying indicators are sales or new orders, production, employment, purchases, prices paid for major purchases, lead times from sellers, purchased materials inventory (raw materials and supplies), and finished goods inventories. The respondents to the survey report the direction of each these activities as either up, the same or down in comparison to the previous month. An index for each of these areas is then calculated by subtracting the percentage of respondents that sight a negative shift from the percentage that sight a positive shift. For indicators that are positively correlated with economic growth, this results in an underlying index that points to expansion when it is above zero. Indicators that are negatively correlated with growth point to expansion when they are below zero.
The final Houston PMI is calculated by applying optimal regression factors to each of the eight underlying indicators noted above. These regression factors are determined using standard regression techniques comparing these underlying indicators to the Houston-The Woodlands-Sugar Land Business Cycle Index (Houston BCI), which is reported on a monthly basis by the Federal Reserve Bank of Dallas. This top-level index is converted to a 0 to 100 scale to match that of the national Purchasing Managers Index® (PMI®) which is published monthly by the Institute for Supply Management® (ISM®). Readings over 50 for the HPMI generally indicate manufacturing expansion in the Houston in the near term and readings below 50 show coming manufacturing contraction.
It is important to note that the manufacturing breakeven HPMI does not equate to the breakeven point for the overall Houston economy. ISM-Houston periodically reviews the capability of its correlations and adjusts the regression factors when appropriate. The most recent revision occurred as a result of a review undertaken during the third quarter of 2018, which determined that changes in the Houston economy over the last decade have shifted the intercept of the correlation, causing a neutral Houston PMI to no longer align with a neutral Houston BCI. A Houston PMI of 45 points now equates to a neutral Houston economy as measured by the Houston BCI. A similar offset between the National PMI and the National economy has existed for some time.
Use of ISM-Houston Business Report Content
All information contained in this report is protected by copyright laws and ISM-Houston retains all rights to this Content. ISM-Houston hereby grants you a limited, revocable license to access, print, and display this Content solely for your personal, non-commercial use. Requests for permission to reproduce or redistribute ISM-Houston Business Report Content can be made by contacting the ISM-Houston Business Survey Committee at hpmi@ism-houston.org.
ISM-Houston shall not have any liability, duty, or obligation for or relating to the ISM-Houston Business Report Content or other information contained herein, any errors, inaccuracies, omissions or delays in providing any ISM-Houston Business Report Content, or for any actions taken in reliance thereon. In no event shall ISM-Houston be liable for any special, incidental, or consequential damages, arising out of the use of the ISM-Houston Business Report.