Analysis and report by Ross Harvison and Murali Rajagopalachari (ISM-Houston Business Survey Committee)
Houston SCMI at 53.3 (down 0.7 points)
Sales/New Orders Expanding
Production Expanding
Employment Expanding
Prices Paid Expanding
Lead Times Expanding
Finished Goods Inventories Contracting
(Houston, Texas) – According to Houston area supply chain executives, the Houston economy expanded again in July. The manufacturing sector contracted for the second time in six months, and non-manufacturing expanded for the sixth month. The overall Houston economy expanded for the 74th month in a row.
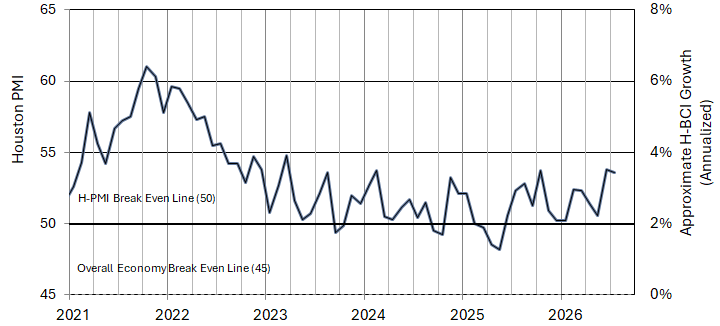
The Houston Supply Chain Managers Index fell 0.7 points to 53.3, indicating continued strong growth in the overall economy. All three of the underlying indicators that have a strong direct correlation with economic activity (sales/new orders, employment, and lead times) are pointing to modest to strong growth. The sales/new orders index fell 3.9 points to 55.5 points, the employment index fell 0.4 points to 51.4, and the lead times index rose 1.9 points to 54.6 points. The finished goods inventory index, the underlying indicator that has the strongest inverse correlation with economic activity, fell 2.1 points to 48.7, pointing to modest economic expansion.
The Houston Manufacturing SCMI fell 2.1 points to 46.4 points. Durable goods manufacturing weakened further while non-durable goods continued to show very modest strength. The non-manufacturing SCMI fell 0.4 points to 54.6, indicating minimal weakening from last month.
On an industry specific basis construction, trade/transportation/warehousing, and professional services reported strong expansion. Oil and Gas reported expansion for the first time in five months. Non-durable goods reported very modest expansion. Durable goods manufacturing continues to report significant weakness.
Note that beginning this month the Houston Affiliate of the Institute for Supply Management has changed the name of the index produced as part of this report to the Houston Supply Chain Managers Index (HSCMI) to recognize the input of a broad group of Supply Chain Leaders in the business survey that is used to develop the report. The analytical methods used to calculate all indices are unchanged.
Click here for the hard copy version of this report.
Houston SCMI Trend
Indices at a Glance
Houston SCMI readings over fifty indicate that respondents see their activities as expanding. An H-SCMI above 45 normally correlates with expansion of the Houston-The Woodlands-Sugar Land Business Cycle Index.
| Index | Jul | Jun | Change | Track | Rate | Trend* |
| Houston Overall PMI | 53.6 | 54.0 | -0.4 | Expanding | Slower | 14 |
| Houston Manufacturing PMI | 46.6 | 48.5 | -1.9 | Contracting | Faster | 2 |
| Houston Non-Manufacturing PMI | 55.0 | 55.0 | 0.0 | Expanding | Unchanged | 6 |
| Sales/New Orders | 56.5 | 59.4 | -2.9 | Expanding | Slower | 7 |
| Production | 52.2 | 52.2 | 0.0 | Expanding | Unchanged | 2 |
| Employment | 52.2 | 51.8 | 0.4 | Expanding | Faster | 6 |
| Purchases | 58.9 | 55.5 | 3.4 | Expanding | Faster | 31 |
| Prices Paid | 62.3 | 61.4 | 0.9 | Expanding | Faster | 10 |
| Lead Times | 53.3 | 52.7 | 0.6 | Expanding | Faster | 8 |
| Purchased Inventory | 51.6 | 48.7 | 2.9 | Expanding | Fr. Cont. | 1 |
| Finished Goods Inventory | 48.7 | 50.8 | -2.1 | Contracting | Fr. Exp. | 1 |
| Overall Houston Economy | Expanding | Slower | 74 | |||
| * Number of months on current track | ||||||
Commodities Reported to be Up/Down in Price or in Short Supply
Up in Price: Motor fuels (gasoline, diesel, jet fuel,). natural gasoline; finished goods, films, production chemicals, nitrogen gas; copper, nickel‡, carbon steel, fabricated steel, stainless steel, stainless steel knitting wire, engineered equipment; electrical equipment, switch gear, memory chips; isotainers, ocean container freight.
Down in Price: Some professional services; crude oil, natural gas, propane, isobutane, naphtha; tape; silver, platinum, aluminum, nickel‡; carbon steel pipe; bulk liquid storage.
In Short Supply: Nitric acid, resins, some base stocks for finished lubricants; electrical equipment, electronic components, electrical gear; overland trucking, rail capacity, isotainers.
‡ Noted as being up or down by different respondents.
What Our Respondents Are Saying:
Oil and Gas Exploration, and Key Support Services:
- Tariffs and geopolitical events continue to cause uncertainty.
- Texas rig counts continue to rise at a modest pace.
- This sector reported significant expansion for the first time in five months. The employment, prices paid, and lead time indices joined the sales/new orders and production indices in reporting positive results.
Construction:
- The changing tariff situation makes it hard to predict price developments.
- Carbon steel pipe was moderately down in price primarily due to global oversupply.
- The global economic outlook is relatively stable; however, the US/ Iran conflict continues to introduce uncertainty with oil prices and trade flows.
- This sector continues to experience strong expansion. The lead times index joined the sales/new orders, employment, purchases, and prices paid indices in showing significant strength.
Durable Goods Manufacturing:
- We are hopeful that increasing oil prices will result in increasing sales for our business.
- This sector weakened further this month. The finished goods inventory index joined the sales/new orders, production, employment, and lead times indices in pointing to significant contraction. Only the purchases and prices paid indices showed strength.
Non-durable Goods Manufacturing:
- Still working through tariff uncertainties.
- Business is steady for now.
- Finally starting to see some relief after the middle east conflict.
- Many producers and customers who adjusted formulations to continue production are starting to shift to original formulas as supply has become more certain.
- Trucking activities saw many off-cycle requests for fuel surcharge increases.
- Cracker feedstock prices continue to be under downward pressure.
- This sector showed limited strength again this month. While the sales/new orders, production, purchases, and prices paid indices pointed to strength, the employment index again showed considerable weakness.
Trade, Transportation, and Warehousing:
- Increased transportation costs are making it through to the supply chain.
- Container freight rates from Asia have doubled since the beginning of the year.
- Ocean container carriers have very little spare capacity.
- Houston air passenger traffic rose in July consistent with normal seasonal trends.
- This sector was reported as expanding at strong pace again this month with sales/new orders, employment, purchases, and prices paid indices registering as expanding at a rapid pace. All other indices were reported near neutral.
Real Estate:
- Houston office real estate vacancies continue to run above 26%, while industrial real estate vacancies remain near 7%.
- New home sales rose in June, while the median price fell.
- Existing home sales and median prices rose in June.
- This sector reported near neutral this month with all indices reporting near this level.
Professional and Business Services:
- Our business continues to be stagnant in terms of companies that are adding staff.
- Unless a company has a unique or specialized requirement for a technical skill set, it is a stable market.
- Prices being paid for either hourly contractor or direct hire at very stable now compared to 6-12 months ago.
- There continues to be uncertainty in the energy sector in terms of oil and gas pricing. A stabilized Iran situation would be beneficial but, for the time being, most Energy companies are operating as if prices stable.
- This sector reported strong expansion with the employment, purchases, and lead times indices showing strength. All other indices reported near neutral.
Trend of Underlying Indicators
Sales/New Order Index
The sales/new orders index fell 3.9 points to 56.5 points during the month. While non-manufacturing reported expansion in this index, manufacturing reported contraction.
| Sales/New Orders | Higher | Same | Lower | Net | Index |
| Feb 2026 | 22% | 75% | 3% | 19% | 56.6 |
| Mar 2026 | 19% | 74% | 7% | 12% | 54.0 |
| Apr 2026 | 17% | 78% | 5% | 12% | 53.5 |
| May 2026 | 11% | 84% | 5% | 6% | 50.3 |
| Jun 2026 | 23% | 72% | 5% | 18% | 59.4 |
| Jul 2026 | 16% | 79% | 5% | 11% | 56.5 |
Production Index
The production index was flat this month at 52.2 points. Non-manufacturing came in well above neutral and manufacturing reported just above neutral.
| Production | Higher | Same | Lower | Net | Index |
| Feb 2026 | 6% | 92% | 2% | 4% | 51.0 |
| Mar 2026 | 4% | 89% | 7% | -3% | 47.4 |
| Apr 2026 | 5% | 93% | 2% | 3% | 50.4 |
| May 2026 | 5% | 90% | 5% | 0% | 48.9 |
| Jun 2026 | 8% | 87% | 5% | 3% | 52.2 |
| Jul 2026 | 9% | 87% | 4% | 5% | 52.2 |
Employment Index
The employment index rose 0.8 points to 52.2, indicating continued minimal expansion for the sixth month. Non-manufacturing came in above neutral and manufacturing continued to report well below this level.
| Employment | Higher | Same | Lower | Net | Index |
| Feb 2026 | 10% | 84% | 6% | 4% | 50.9 |
| Mar 2026 | 6% | 90% | 4% | 2% | 51.0 |
| Apr 2026 | 8% | 88% | 4% | 4% | 50.7 |
| May 2026 | 8% | 86% | 6% | 2% | 50.5 |
| Jun 2026 | 13% | 79% | 8% | 5% | 51.4 |
| Jul 2026 | 12% | 80% | 8% | 4% | 52.2 |
Purchases Index
The purchases index rose 3.4 points to 58.9 points with both non-manufacturing and manufacturing reporting near this level.
| Purchases | Higher | Same | Lower | Net | Index |
| Feb 2026 | 21% | 77% | 2% | 19% | 57.9 |
| Mar 2026 | 17% | 77% | 6% | 11% | 54.1 |
| Apr 2026 | 19% | 75% | 6% | 13% | 53.8 |
| May 2026 | 20% | 74% | 6% | 14% | 55.1 |
| Jun 2026 | 18% | 75% | 7% | 11% | 55.5 |
| Jul 2026 | 20% | 78% | 2% | 18% | 58.9 |
Prices Paid Index
The purchases index rose 0.9 points to 62.3 points with both non-manufacturing and manufacturing continuing to report strong expansion.
| Prices Paid | Higher | Same | Lower | Net | Index |
| Feb 2026 | 23% | 74% | 3% | 20% | 58.1 |
| Mar 2026 | 25% | 73% | 2% | 23% | 59.5 |
| Apr 2026 | 34% | 64% | 2% | 32% | 64.3 |
| May 2026 | 35% | 63% | 2% | 33% | 65.1 |
| Jun 2026 | 23% | 74% | 3% | 20% | 61.4 |
| Jul 2026 | 24% | 74% | 2% | 22% | 62.3 |
Lead Times Index
The purchases index rose 0.6 points to 53.3 points with manufacturing reporting continuing strong expansion in this index and non-manufacturing reporting just above neutral.
| Lead Times | Higher | Same | Lower | Net | Index |
| Feb 2026 | 7% | 89% | 4% | 3% | 50.1 |
| Mar 2026 | 17% | 79% | 4% | 13% | 54.0 |
| Apr 2026 | 7% | 91% | 2% | 5% | 51.0 |
| May 2026 | 9% | 86% | 5% | 4% | 51.3 |
| Jun 2026 | 8% | 89% | 3% | 5% | 52.7 |
| Jul 2026 | 14% | 80% | 6% | 8% | 53.3 |
Purchased Inventory Index
The purchased inventory index rose 2.9 points to 51.6 with non-manufacturing reporting just above neutral and manufacturing reporting strong expansion in this index.
| Purchased Inventory | Higher | Same | Lower | Net | Index |
| Feb 2026 | 6% | 91% | 3% | 3% | 53.6 |
| Mar 2026 | 5% | 90% | 5% | 0% | 48.3 |
| Apr 2026 | 4% | 90% | 6% | -2% | 49.2 |
| May 2026 | 3% | 93% | 4% | -1% | 48.1 |
| Jun 2026 | 3% | 92% | 5% | -2% | 48.7 |
| Jul 2026 | 5% | 92% | 3% | 2% | 51.6 |
Finished Goods Inventory Index
The finished goods inventory index returned to below neutral, falling 2.1 points to 48.7 points. Manufacturing reported well below this level while non-manufacturing remained near neutral.
| Finished Goods Inventories | Higher | Same | Lower | Net | Index |
| Feb 2026 | 4% | 91% | 5% | -1% | 49.7 |
| Mar 2026 | 6% | 89% | 5% | 1% | 50.7 |
| Apr 2026 | 8% | 86% | 6% | 2% | 51.3 |
| May 2026 | 5% | 90% | 5% | 0% | 49.7 |
| Jun 2026 | 7% | 88% | 5% | 2% | 50.8 |
| Jul 2026 | 4% | 89% | 7% | -3% | 48.7 |
Houston SCMI Calculation Methods
The Houston Supply Chain Managers Index has been included as an integral part of the ISM-Houston Business Report since the Houston affiliate of the Institute for Supply Management started publishing this document in January 1995. The report and index are issued monthly as the primary deliverables from a survey of Houston area Supply Chain leaders regarding the status of key activities that provide insight into the strength of the economy. The respondents come from diverse organizations including construction, energy, engineering, health care, durable and non-durable goods manufacturing, financial and business services, wholesale and retail trade, and utilities related companies.
The Houston Supply Chain Managers Index is determined from diffusion indices of the eight indicators of economic activity covered by the ISM-Houston Business Survey and Report. These underlying indicators are sales or new orders, production, employment, purchases, prices paid for major purchases, lead times from sellers, purchased materials inventory (raw materials and supplies), and finished goods inventories. The respondents to the survey report the direction of each of these activities as either up, the same, or down in comparison to the previous month. An index for each of these areas is then calculated by subtracting the percentage of respondents that sight a negative shift from the percentage that sight a positive shift. For indicators that are positively correlated with economic growth, this results in an underlying index that points to expansion when it is above zero. Indicators that are negatively correlated with growth point to expansion when they are below zero.
The final Houston SCMI is calculated by applying optimal regression factors to each of the eight underlying indicators noted above. These regression factors are determined using standard regression techniques comparing these underlying indicators to the Houston-The Woodlands-Sugar Land Business Cycle Index (Houston BCI), which is reported monthly by the Federal Reserve Bank of Dallas. This top-level index is converted to a 0 to 100 scale to match that of the national Purchasing Managers Index® (PMI®) which is published monthly by the Institute for Supply Management® (ISM®). Readings over 50 for the HSCMI generally indicate manufacturing expansion in Houston in the near term and readings below 50 show coming manufacturing contraction.
It is important to note that the manufacturing breakeven HSCMI does not equate to the breakeven point for the overall Houston economy. ISM-Houston periodically reviews the capability of its correlations and adjusts the regression factors when appropriate. The most recent revision occurred in 2018 after it was determined that changes in the Houston economy over the previous decade had shifted the intercept of the correlation, causing a neutral Houston SCMI to no longer align with a neutral Houston BCI. A Houston SCMI of 45 points now equates to a neutral Houston economy as measured by the Houston BCI. A similar offset between the National SCMI and the National economy has existed for some time.
Use of ISM-Houston Business Report Content
All information included in this report is protected under copyright law, and ISM-Houston reserves all rights to this content. ISM-Houston grants a limited, revocable license for personal, non-commercial use, including access, printing, and display of content. Requests for permission to reproduce or redistribute the ISM-Houston Business Report content should be directed to the ISM-Houston Business Survey Committee at HSCMI@ism-houston.org.
ISM-Houston assumes no liability, obligation, or responsibility for the accuracy, completeness, or timeliness of the information contained herein. This includes any errors, omissions, or delays in providing the report. Furthermore, ISM-Houston shall not be liable for any damages, whether direct, incidental, consequential, or special, arising from the use or reliance on the information provided in this report.
ISM-Houston Business Report Background
The ISM-Houston Business Report has provided some of the best information regarding what is happening in the Greater Houston area economy for over 30 years. It delivers significant analytical data along with a summary of what Houston area Supply Chain Leaders are saying about the economy and is subscribed to by a wide range of global business leaders, economists, researchers, and reporters.
The report and index are published monthly as the primary deliverables from a survey of Houston area Supply Chain professionals. These highly engaged leaders provide information on key activities that are related to the strength of the economy. They come from diverse organizations including construction, energy, engineering, health care, durable and non-durable goods manufacturing, financial and business services, wholesale and retail trade, and utilities related companies.
We are always looking to improve our coverage of the industries that make up our economy. Please join us to help make our results even more representative of what’s happening in Houston by completing this signup form.