
For release November 10, 2022
October 2022 ISM-Houston Business Report
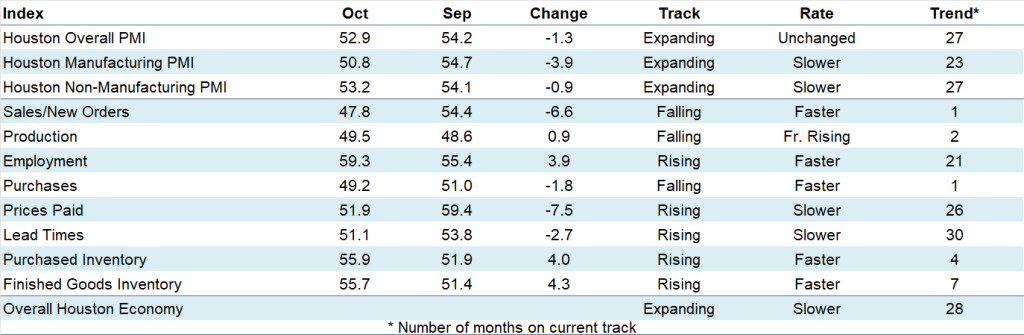
Houston PMI at 52.9 (down 1.3 points)
Sales/New Orders at 47.8 (down 6.6 points)
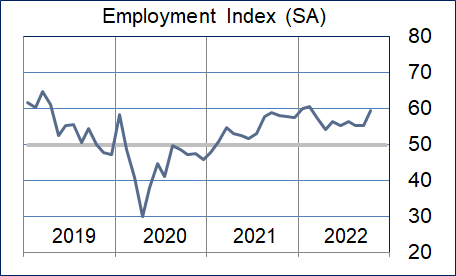
Employment at 59.3 (up 3.9 points)
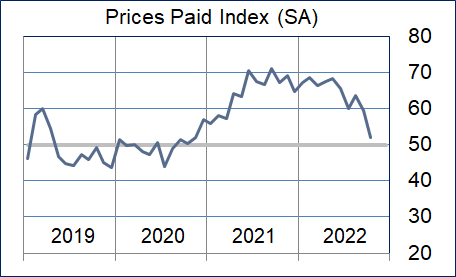
Prices Paid at 51.9 (down 7.5 points)
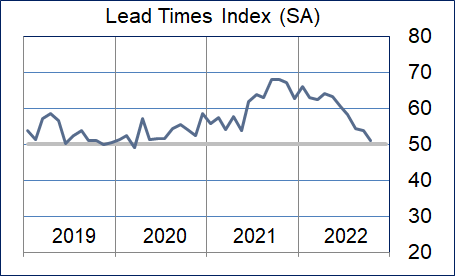
Lead Times at 51.1 (down 2.7 points)
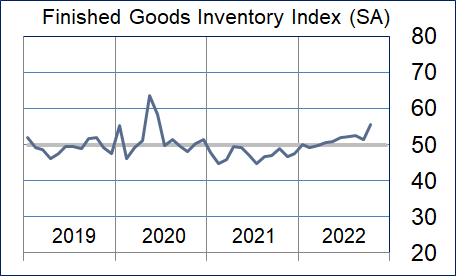
Finished Goods Inventories at 55.7 (up 4.3 points)
(Houston, Texas) – According to Houston area supply chain executives, economic activity in Houston expanded at a somewhat slower pace in October. Manufacturing sector activity fell to near neutral while non-manufacturing activity showed a minimally slower expansion rate.
The Houston Purchasing Managers Index fell 1.3 points to 52.9. Two of the underlying indicators that have the strongest correlation with the Houston economy fell considerably while the third showed stronger expansion. The sales/new orders index fell 6.6 points to 47.8, indicating contraction. The lead times index fell 2.7 points to 51.1. The employment index rose 3.9 points to 59.3, pointing to stronger expansion. The Finished goods inventory index, the underlying indicator that has the strongest inverse correlation with economic activity, rose 4.3 points to 55.7, giving a stronger indication of contraction.
As noted earlier this year, ISM-Houston is now reporting separate indices for manufacturing and non-manufacturing industries in addition to the overall Houston Purchasing Managers Index. The HPMI forecast has been eliminated from this report. The Houston Manufacturing PMI fell 3.9 points to 50.8, pointing to very modest expansion. The non-manufacturing PMI fell 0.9 points to 53.2, showing modestly slower expansion for the industries in this sector.
On an industry specific basis, health care, professional and management services, oil & gas, construction, transportation, trade, and warehousing reported strong expansion. Manufacturing, and leisure and hospitality reported very modest expansion. Real estate reported significant contraction.
The Houston PMI provides a measure of current economic activity in the greater Houston area and a forecast of likely shifts in activity over a three-month forecast horizon. These indicators have a possible range of 0 to 100. Readings over 50 generally indicate goods producing industry expansion; readings below 50 show contraction. A PMI above 45 generally correlates with expansion of the Houston-The Woodlands-Sugar Land Business Cycle Index. The current and forecast PMI indices are based on diffusion indices for eight underlying indicators: Sales/New Orders, Production, Employment, Purchases, Prices Paid, Lead Times, Purchase Inventory, and Finished Goods Inventory.
Click here to see the PDF version of the full report.
Indices at a Glance
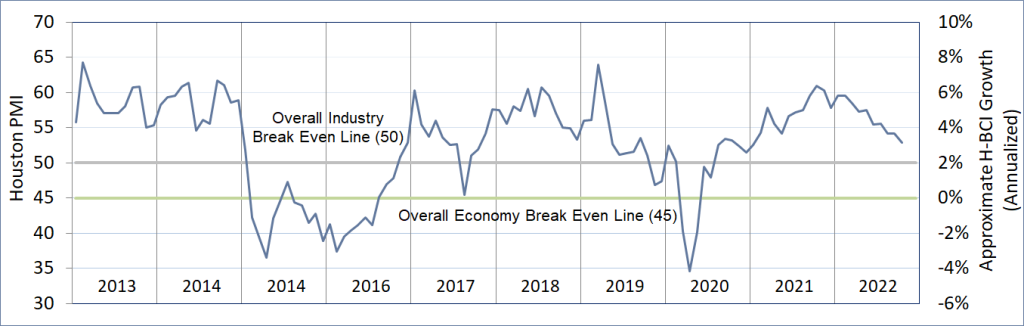
Houston PMI Trend
Houston PMI readings over 50 generally indicate that respondents see their activities as expanding. An HPMI above 45 normally correlates with expansion of the Houston-The Woodlands-Sugar Land Business Cycle Index (H-BCI).
Commodities Reported to have Notable Price Changes or to be in Short Supply
Up in Price: Skilled, unskilled, and professional/technical labor; crude oil, gasoline, diesel, jet fuel; oil country tubular goods (OCTG) – casing and tubing, carbon steel products‡, flanges, fittings, electrical equipment/gear, some mechanical equipment, concrete/cement; bulk ocean, rail, and truck freight; food
Down in Price: Natural gas, natural gas liquids, ethane, propane, butane, isobutane, ethylene, propylene, caustic, bisphenol-acetone (BPA), methanol, styrene, oil field chemicals, PVC resins, polyethylene resins, polypropylene resins; carbon steel‡, aluminum products; containerized ocean freight
In Short Supply: Skilled, unskilled, light industrial, heavy industrial, IT, and professional/technical labor, senior consultants; formula and nutrition products, soda lime, anesthesia supplies, speculum, lab supplies; paraformaldehyde, phosphoric acid, uncured rubber compounds; carbon steel pipe, flanges, fittings, oil country tubular goods (OCTG), electrical gear, cement, mechanical equipment, generators, fabricated millwork, power supplies, variable frequency drives; computers and associated hardware; bulk ocean freight
‡ reported as up or down by different respondents
What our Respondents are Saying
Oil and Gas Exploration, and Key Support Services:
- Rig counts are rising at a very slow pace
- Attracting and retaining labor is still a challenge for oil & gas service companies
- This sector reported modestly higher growth with the production, employment, purchases, and prices paid indices showing significant strength; the lead times index fell to neutral
Construction:
- Labor availability continues to be a challenge
- Cautious optimism on projects, any shift to infrastructure may keep some equipment and material in demand
- Performance in this sector remained near neutral with the sales/new orders, prices paid, and lead times indices continuing to show significant contraction; the employment index remained strong
Durable Goods Manufacturing:
- Business cooled off a bit, however we expect the general trend of increased demand and production to continue into the coming months
- This sector moved to modest contraction this month with the sales/new orders and prices paid indices pointing to significant contraction while the production index showed strength
Non-durable Goods Manufacturing:
- Refinery inputs were down modestly
- Most pricing was flat
- Anticipating multiple headwinds in 1H23 and beyond; demand outlook is lower than same period 2022; production cuts initiated in 4Q22 to manage supply-demand balance
- This sector weakened but remained above neutral; the sales/new orders, production, and purchases indices came in well below neutral while the employment, prices paid and lead times indices remained strong
Trade, Transportation, and Warehousing:
- CapEx projects pending outcome of election
- Trend indicates business demand is slowing
- This sector reported expansion at a significantly slower pace; the sales/new orders, purchases, prices paid, and lead times indices all came in below neutral while the employment index continued to show strength
Real-Estate Services:
- Demand for new and existing homes has continued to slow
- This sector’s performance fell further below neutral with the sales/new orders, purchases, and lead times indices falling well below neutral; all other indices reported at or just above neutral; industrial and apartment related real-estate reported continued expansion while housing contracted at a very rapid pace
Professional and Business Services:
- Job openings still exceed job applicants, but the gap is closing
- Companies are slowing their hiring of direct and contract labor; fears of a recession are impacting hiring decisions
- Still seeing strong demand and having difficulty meeting it; expect this to cool off toward the end of the year
- Prices for hourly and salary positions have leveled off, but remain considerably higher than earlier this year
- This sector continued to expand at a higher rate driven by a significant increase in the employment index; all other indices came in near neutral
Leisure and Hospitality:
- This sector continues to expand at a very slow rate
Health Care:
- Labor market is loosening but cost is not; healthcare demand is stable and we have no difficulty filling out new clinics
- The potential railway strike is making us stock up on essential supplies and inventories
- Lead times have stabilized but this might be short term with winter and the rail strike looming
- Continuing to experience price increases being passed from manufacturers, distributors, and the express couriers
- Evaluating a larger number of substitutes and alternate products to ensure sufficient inventories of needed commodities
- An unusual increase in flu cases is causing us to increase the purchase of needles, syringes and various test kits
- This sector continued to report strong growth during the month with the employment index joining the sales/new orders, purchases, prices paid, and lead times indices showing significant expansion
Trend of Underlying Indicators
The Houston PMI is based on diffusion indices for eight underlying indicators. The net value of each indicator is simply the percentage of respondents who cite a positive shift from the previous month minus the percentage who cite a negative shift. The diffusion index is calculated based on the percent of respondents reporting higher results plus one-half of those responding the same with a seasonal adjustment based on an X13 ARIMA forecast. Values above 50 for Sales/New Orders, Production, Employment, Prices Paid, and Lead Times generally point towards expansion and values below 50 signal contraction. Note that the Prices Paid Index may not follow this trend late in an economic expansion. The Inventory measures have an inverse correlation at most forecast horizons, meaning that values below 50 point to expansion and values above point to contraction. The Purchases index is inversely correlated with economic activity at the three-month forecast horizon.
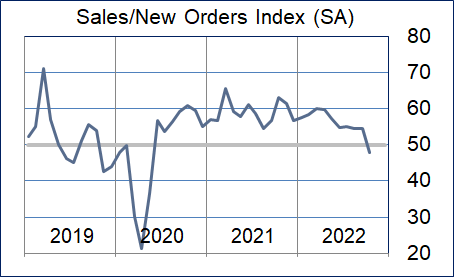
Sales/New Orders
The sales/new orders index fell below neutral with both manufacturing and nonmanufacturing reporting contraction. Only healthcare reported significant strength.
| Higher | Same | Lower | Net | Index | |
| May/22 | 21% | 77% | 2% | 19% | 57.4 |
| Jun/22 | 14% | 82% | 4% | 10% | 54.8 |
| Jul/22 | 15% | 81% | 4% | 11% | 55.0 |
| Aug/22 | 14% | 82% | 4% | 10% | 54.6 |
| Sep/22 | 17% | 75% | 8% | 9% | 54.4 |
| Oct/22 | 6% | 81% | 13% | -7% | 47.8 |
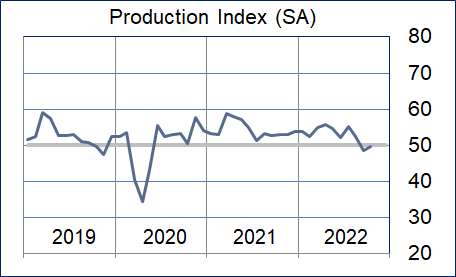
Production Index
The production index rose modestly but remained below neutral with both manufacturing and nonmanufacturing activities reporting contraction.
| Higher | Same | Lower | Net | Index | |
| May/22 | 12% | 87% | 1% | 11% | 54.6 |
| Jun/22 | 7% | 91% | 2% | 5% | 52.0 |
| Jul/22 | 13% | 84% | 3% | 10% | 55.1 |
| Aug/22 | 10% | 85% | 5% | 5% | 52.5 |
| Sep/22 | 6% | 85% | 9% | -3% | 48.6 |
| Oct/22 | 7% | 85% | 8% | -1% | 49.5 |
Employment Index
The employment index rose with oil & gas and healthcare rejoining construction, transportation and trade, and professional services in reporting strength in this index.
| May/22 | 17% | 81% | 2% | 15% | 56.4 |
| Jun/22 | 15% | 84% | 1% | 14% | 55.3 |
| Jul/22 | 15% | 83% | 2% | 13% | 56.3 |
| Aug/22 | 14% | 84% | 2% | 12% | 55.4 |
| Sep/22 | 15% | 83% | 2% | 13% | 55.4 |
| Oct/22 | 20% | 78% | 2% | 18% | 59.3 |
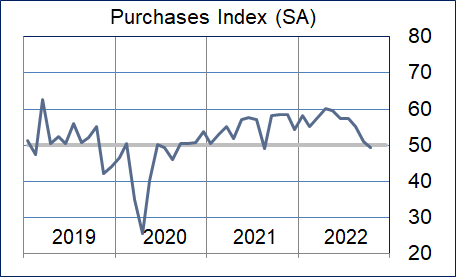
Purchases Index
The purchases index fell to just below neutral. Oil & gas joined construction, professional services, and health care to report strength while real estate and wholesale trade joined durable goods to report weakness.
| May/22 | 21% | 77% | 2% | 19% | 59.6 |
| Jun/22 | 19% | 79% | 2% | 17% | 57.4 |
| Jul/22 | 17% | 79% | 4% | 13% | 57.5 |
| Aug/22 | 19% | 74% | 7% | 12% | 55.1 |
| Sep/22 | 11% | 84% | 5% | 6% | 51.0 |
| Oct/22 | 8% | 81% | 11% | -3% | 49.2 |
Prices Paid Index
The prices paid index fell significantly to near neutral. Health care, nondurable goods manufacturing, O&G, and health care reported this index as expanding. Construction and real estate reported it as contracting.
| Higher | Same | Lower | Net | Index | |
| May/22 | 41% | 58% | 1% | 40% | 68.4 |
| Jun/22 | 33% | 65% | 2% | 31% | 65.7 |
| Jul/22 | 24% | 69% | 7% | 17% | 60.0 |
| Aug/22 | 29% | 67% | 4% | 25% | 63.6 |
| Sep/22 | 21% | 76% | 3% | 18% | 59.4 |
| Oct/22 | 16% | 72% | 12% | 4% | 51.9 |
Lead Times Index
The lead times fell to near neutral. Nondurable goods manufacturing and healthcare reported continued long lead times while construction, transportation and trade, and real estate reported lower lead times.
| May/22 | 33% | 63% | 4% | 29% | 63.4 |
| Jun/22 | 26% | 70% | 4% | 22% | 60.4 |
| Jul/22 | 22% | 73% | 5% | 17% | 58.3 |
| Aug/22 | 17% | 76% | 7% | 10% | 54.4 |
| Sep/22 | 15% | 77% | 8% | 7% | 53.8 |
| Oct/22 | 10% | 80% | 10% | 0% | 51.1 |
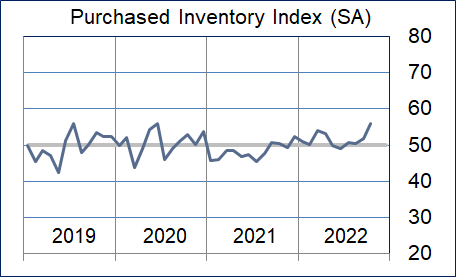
Purchased Inventory Index
The purchased inventory index rose with transportation and trade, and health care reporting significant increases. Durable goods manufacturing reported these inventories as contracting at a fast pace again this month.
| Higher | Same | Lower | Net | Index | |
| May/22 | 6% | 92% | 2% | 4% | 49.7 |
| Jun/22 | 7% | 86% | 7% | 0% | 49.1 |
| Jul/22 | 9% | 85% | 6% | 3% | 50.8 |
| Aug/22 | 9% | 84% | 7% | 2% | 50.4 |
| Sep/22 | 6% | 88% | 6% | 0% | 51.9 |
| Oct/22 | 8% | 88% | 4% | 4% | 55.9 |
Finished Goods Inventory Index
The finished goods inventory index rose. Transportation and trade reported this index as expanding at a rapid pace. Manufacturing reported it as contracting.
| Higher | Same | Lower | Net | Index | |
| May/22 | 5% | 91% | 4% | 1% | 50.8 |
| Jun/22 | 5% | 92% | 3% | 2% | 51.9 |
| Jul/22 | 8% | 88% | 4% | 4% | 52.1 |
| Aug/22 | 9% | 86% | 5% | 4% | 52.6 |
| Sep/22 | 7% | 87% | 6% | 1% | 51.4 |
| Oct/22 | 11% | 81% | 8% | 3% | 55.7 |
Background on the ISM-Houston Business Report and HPMI Calculation Methods
The Houston Purchasing Managers Index has been included as an integral part of the ISM-Houston Business Report since the Houston chapter of the Institute for Supply Management started publication of this document in January 1995. The report and index are published monthly as the primary deliverables from a survey of Houston area Supply Chain leaders regarding the status of key activities believed to provide insight into the strength of the economy. The respondents come from diverse organizations including construction, energy, engineering, health care, durable and non-durable goods manufacturing, financial and business services, wholesale and retail trade, and utilities related companies.
The Houston Purchasing Managers Index is determined from diffusion indices of the eight indicators of economic activity covered by the ISM-Houston Business Survey and Report. These underlying indicators are sales or new orders, production, employment, purchases, prices paid for major purchases, lead times from sellers, purchased materials inventory (raw materials and supplies), and finished goods inventories. The respondents to the survey report the direction of each these activities as either up, the same or down in comparison to the previous month. An index for each of these areas is then calculated by subtracting the percentage of respondents that sight a negative shift from the percentage that sight a positive shift. For indicators that are positively correlated with economic growth, this results in an underlying index that points to expansion when it is above zero. Indicators that are negatively correlated with growth point to expansion when they are below zero.
The final Houston PMI is calculated by applying optimal regression factors to each of the eight underlying indicators noted above. These regression factors are determined using standard regression techniques comparing these underlying indicators to the Houston-The Woodlands-Sugar Land Business Cycle Index (Houston BCI), which is reported on a monthly basis by the Federal Reserve Bank of Dallas. This top-level index is converted to a 0 to 100 scale to match that of the national Purchasing Managers Index® (PMI®) which is published monthly by the Institute for Supply Management® (ISM®). Readings over 50 for the HPMI generally indicate manufacturing expansion in the Houston in the near term and readings below 50 show coming manufacturing contraction.
It is important to note that the manufacturing breakeven HPMI does not equate to the breakeven point for the overall Houston economy. ISM-Houston periodically reviews the capability of its correlations and adjusts the regression factors when appropriate. The most recent revision occurred as a result of a review undertaken during the third quarter of 2018, which determined that changes in the Houston economy over the last decade have shifted the intercept of the correlation, causing a neutral Houston PMI to no longer align with a neutral Houston BCI. A Houston PMI of 45 points now equates to a neutral Houston economy as measured by the Houston BCI. A similar offset between the National PMI and the National economy has existed for some time.
Use of ISM-Houston Business Report Content
All information contained in this report is protected by copyright laws and ISM-Houston retains all rights to this Content. ISM-Houston hereby grants you a limited, revocable license to access, print, and display this Content solely for your personal, non-commercial use. Requests for permission to reproduce or redistribute ISM-Houston Business Report Content can be made by contacting the ISM-Houston Business Survey Committee at hpmi@ism-houston.org.
ISM-Houston shall not have any liability, duty, or obligation for or relating to the ISM-Houston Business Report Content or other information contained herein, any errors, inaccuracies, omissions or delays in providing any ISM-Houston Business Report Content, or for any actions taken in reliance thereon. In no event shall ISM-Houston be liable for any special, incidental, or consequential damages, arising out of the use of the ISM-Houston Business Report.