
For release February 10, 2022
February 2022 ISM-Houston Business Report
Houston PMI at 59.5
Sales/New Orders at 58.3
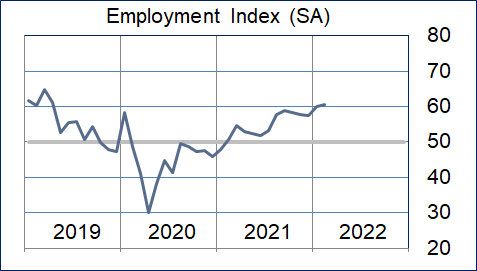
Employment at 60.5
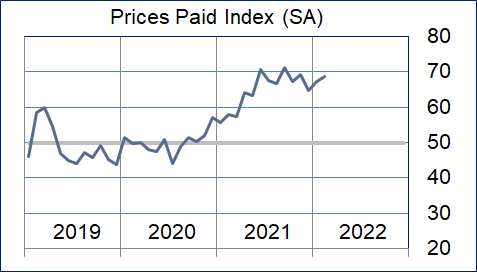
Prices Paid at 68.7
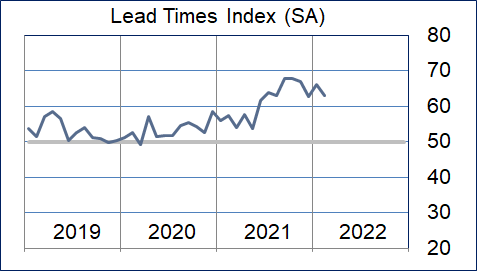
Lead Times at 62.9
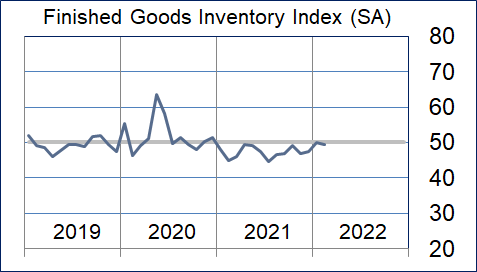
Finished Goods Inventories at 49.3
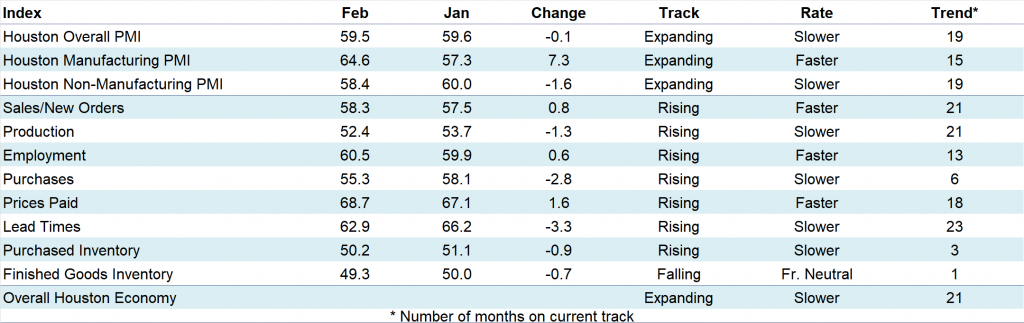
(Houston, Texas) – According to Houston area supply chain executives, economic activity in Houston expanded in February at a similar rate to the previous month. The ISM-Houston PMI diffusion index fell minimally. Non-manufacturing activities expanded at a modestly slower rate while manufacturing activities expanded at a significantly faster pace during the month.
The Houston Purchasing Managers Index fell 0.1 points to 59.5 during the month. Strength in the sales/new orders, employment, and lead times indices are responsible for the continued indication of economic growth. These indicators have the strongest direct correlation with economic activity in Houston. The sales/new orders index rose 0.8 points to 58.3, the employment index rose 0.6 points to 60.5, and the lead times index fell 3.3 points to 62.9. The Finished goods inventory index, the underlying indicator that has the strongest inverse correlation with economic activity, fell 0.7 points to just below neutral at 49.3, giving a very small indication of expansion.
As noted last month, ISM-Houston is now reporting separate indices for manufacturing and non-manufacturing industries in addition to the overall Houston Purchasing Managers Index. The HPMI forecast has been eliminated from this report. The Houston Manufacturing PMI rose a strong 7.3 points to 64.6, pointing to very strong expansion. The non-manufacturing PMI fell a modest 1.6 points to 58.4 showing a slightly lower expansion signal for the industries in this sector.
On an industry specific basis, oil & gas, healthcare, professional and management services, manufacturing, construction, and trade and transportation reported strong expansion. Leisure and hospitality, and real estate reported near neutral month over month.
Click here for the hard copy version of the report.
Indices at a Glance
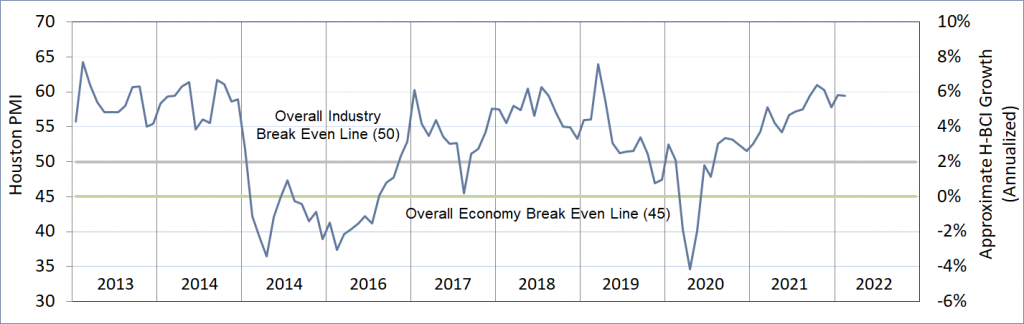
Houston PMI Trend
Houston PMI readings over 50 generally indicate that respondents see their activities as expanding. An HPMI above 45 normally correlates with expansion of the Houston-The Woodlands-Sugar Land Business Cycle Index (H-BCI).
Commodities Reported to have Notable Price Changes or to be in Short Supply
Up in Price: Medical and surgical supplies; consulting services, skilled, unskilled, professional, and technical labor; drilling rigs, oil country tubular goods (OCTG); crude oil, motor fuels, natural gas; ethane, propane, butane, isobutane, natural gasoline, natural gas liquids; propylene, ethylene oxide derivatives, propylene oxide derivatives, toluene, xylene, styrene, chemicals; polyethylene, polypropylene; gold, platinum, and rhodium for catalysts; aluminum, copper, nickel; carbon and alloy steel products, carbon and alloy valves, heat exchangers, transformers, lumber; computer hardware, process automation equipment, software; marine, rail, and truck transportation
Down in Price: Fracking sand; containerized freight from Asia
In Short Supply: Medical fluids and solutions; skilled labor, rig labor, light industrial labor, IT Professionals; drilling rigs, oil country tubular goods (OCTG); silicon sealants, chemicals; carbon, stainless and high alloy valves; computer hardware and other equipment with semiconductors; marine transportation
‡ reported as up or down by different respondents
What our Respondents are Saying
Oil and Gas Exploration, and Key Support Services:
- Elevated fuel costs are expected to cause domino inflation across the supply chain, with energy and fuel prices as key components to manufacturing and logistics
- We are seeing continued price escalations and longer lead times
- Increased activity due to higher oil prices and higher costs are making it difficult to keep expenses within budget
- This sector strengthened again this month with the production, employment, purchases, prices paid, and lead times indices continuing to show considerable strength
Construction:
- Potential impacts from the war in the Ukraine are unknown; energy prices are expected to increase significantly
- This sector reported modestly lower growth; the employment, purchases, and prices paid indices remained strong while the lead times index fell to near neutral
Durable Goods Manufacturing:
- As a manufacturer of equipment for the energy industry, we expect our business activity and sales to increase throughout the course of the year; there will be ongoing challenges with inflation and extended material lead times
- This sector improved significantly to show strong growth; the sales and employment indices joined the prices paid and lead times indices to show strength while the production and purchases indices fell to near neutral, the inventory indices fell to below neutral
Non-durable Goods Manufacturing:
- We are seeing significant pressure on feedstock prices due to increased crude oil prices
- This sector strengthened considerably during the month; the sales/new orders and purchases indices joined the production, employment, prices paid, and lead times indices well above neutral; the inventory indices fell back below neutral
Trade, Transportation, and Warehousing:
- Business is being rationalized to our most profitable products
- This sector showed strong expansion again this month; the employment index joined the sales/new orders and lead time indices in expanding at a fast pace; all other indicators came in near neutral
Real-Estate Services:
- Rising interest rates have not affected home sales
- This sector continued to expand at a modest pace with the prices paid and lead times indices reported as well above neutral; all other indices were reported near neutral
Professional and Business Services:
- Demand for talent continues to increase while supply of talent remains flat at best; this is driving up the cost of labor across all skill levels as companies are having to pay more to attract and retain talent
- The Great Resignation is real as employees are quitting jobs in record numbers; this trend is expected to continue into 2023
- We are seeing a depletion of available talent in the market place; demand has picked up significantly in last 2 months
- Direct hire and hourly workers are demanding more compensation and getting it; average is about 10 percent higher
- Hold on to your seats if the energy companies think it is time to spend capital
- This sector reported expansion at a strong pace again this month with the sales/new orders, employment, prices paid, and lead times indices pointing to rapid expansion; the purchases index fell to neutral
Leisure and Hospitality:
- Activity in this sector remained just above neutral during the month with all indices reported near neutral
Health Care:
- We continue to be impacted by shortages in the market place; many products still on allocation and organizations are now relying on their secondary and tertiary alternative products; the Clinical Value Analysis teams are very busy evaluating a wide range of products to ensure they meet the necessary clinical requirements
- This sector continued to report expansion at a high rate with strength in the sales/new orders, employment, purchases, prices paid, and lead times indices
Trend of Underlying Indicators
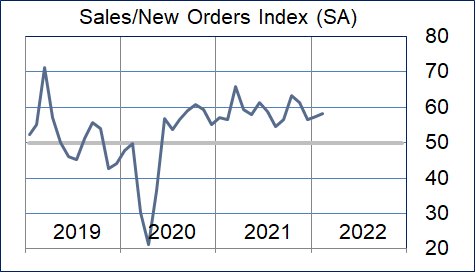
Sales/New Orders
The sales/new orders index rose modestly due to strengthening in both durable and non-durable goods manufacturing. This index continued to show strength in the non-manufacturing sectors as well.
| Higher | Same | Lower | Net | Index | |
| Sep/21 | 15% | 84% | 1% | 14% | 56.7 |
| Oct/21 | 23% | 75% | 2% | 21% | 63.2 |
| Nov/21 | 17% | 82% | 1% | 16% | 61.4 |
| Dec/21 | 12% | 82% | 6% | 6% | 56.6 |
| Jan/22 | 18% | 80% | 2% | 16% | 57.5 |
| Feb/22 | 21% | 78% | 1% | 20% | 58.3 |
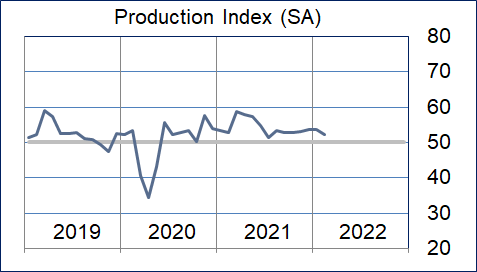
Production Index
The production index fell modestly during the month with durable goods manufacturing falling to near neutral. Non-durable goods manufacturing and oil & gas continue to report considerable strength in this index.
| Higher | Same | Lower | Net | Index | |
| Sep/21 | 10% | 86% | 4% | 6% | 52.7 |
| Oct/21 | 10% | 86% | 4% | 6% | 52.9 |
| Nov/21 | 7% | 92% | 1% | 6% | 53.0 |
| Dec/21 | 8% | 90% | 2% | 6% | 53.7 |
| Jan/22 | 10% | 89% | 1% | 9% | 53.7 |
| Feb/22 | 7% | 92% | 1% | 6% | 52.4 |
Employment Index
The employment index rose modestly again during the month. Durable goods manufacturing joined, professional and business services, health care, oil & gas, construction, and non-durable goods in reporting above neutral.
| Higher | Same | Lower | Net | Index | |
| Sep/21 | 19% | 80% | 1% | 18% | 58.9 |
| Oct/21 | 21% | 73% | 6% | 15% | 58.2 |
| Nov/21 | 20% | 74% | 6% | 14% | 57.7 |
| Dec/21 | 16% | 82% | 2% | 14% | 57.5 |
| Jan/22 | 18% | 81% | 1% | 17% | 59.9 |
| Feb/22 | 21% | 78% | 1% | 20% | 60.5 |
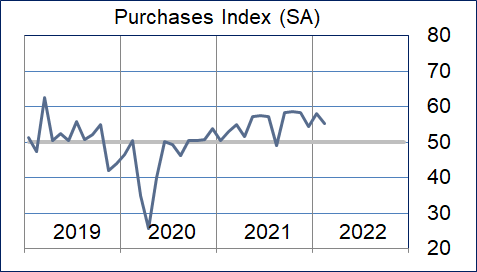
Purchases Index
The purchases index continued to indicate strength. Non-durable goods joined health care, oil & gas, construction, transportation, warehousing, and professional and business services to show strength. Durable goods fell to near neutral.
| Higher | Same | Lower | Net | Index | |
| Sep/21 | 22% | 78% | 0% | 22% | 58.3 |
| Oct/21 | 20% | 78% | 2% | 18% | 58.6 |
| Nov/21 | 16% | 82% | 2% | 14% | 58.4 |
| Dec/21 | 8% | 88% | 4% | 4% | 54.4 |
| Jan/22 | 20% | 79% | 1% | 19% | 58.1 |
| Feb/22 | 11% | 88% | 1% | 10% | 55.3 |
Prices Paid Index
The prices paid index rose modestly during the month. Almost all sectors continued to report this index as expanding at a rapid pace.
| Higher | Same | Lower | Net | Index | |
| Sep/21 | 42% | 58% | 0% | 42% | 71.1 |
| Oct/21 | 39% | 61% | 0% | 39% | 67.1 |
| Nov/21 | 37% | 62% | 1% | 36% | 69.2 |
| Dec/21 | 26% | 72% | 2% | 24% | 64.7 |
| Jan/22 | 36% | 63% | 1% | 35% | 67.1 |
| Feb/22 | 39% | 60% | 1% | 38% | 68.7 |
Lead Times Index
The lead times index fell during the month but remained well above neutral. Most sectors reported this index as continuing to expand at a rapid pace. Trade, transportation, and warehousing reported below neutral again this month.
| Higher | Same | Lower | Net | Index | |
| Sep/21 | 36% | 64% | 0% | 36% | 67.9 |
| Oct/21 | 35% | 64% | 1% | 34% | 68.0 |
| Nov/21 | 35% | 62% | 3% | 32% | 67.1 |
| Dec/21 | 26% | 70% | 4% | 22% | 62.8 |
| Jan/22 | 32% | 64% | 4% | 28% | 66.2 |
| Feb/22 | 31% | 65% | 4% | 27% | 62.9 |
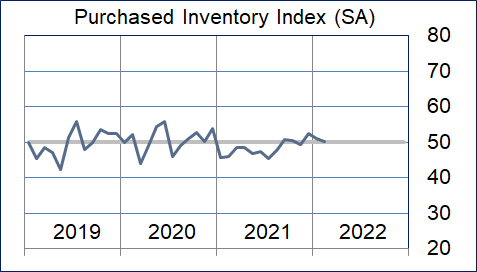
Purchased Inventory Index
The purchased inventory index fell modestly to remain just above neutral. Trade, transportation, and warehousing reported these inventories as expanding while oil & gas and manufacturing reported them as falling.
| Higher | Same | Lower | Net | Index | |
| Sep/21 | 2% | 96% | 2% | 0% | 50.8 |
| Oct/21 | 2% | 95% | 3% | -1% | 50.4 |
| Nov/21 | 2% | 95% | 3% | -1% | 49.3 |
| Dec/21 | 2% | 97% | 1% | 1% | 52.3 |
| Jan/22 | 9% | 90% | 1% | 8% | 51.1 |
| Feb/22 | 7% | 90% | 3% | 4% | 50.2 |
Finished Goods Inventory Index
The finished goods inventory index fell to just below neutral. Manufacturing joined new home construction to report this index as contracting at a rapid pace. Trade, transportation, and warehousing reported these inventories as rising.
| Higher | Same | Lower | Net | Index | |
| Sep/21 | 0% | 92% | 8% | -8% | 47.0 |
| Oct/21 | 0% | 93% | 7% | -7% | 49.1 |
| Nov/21 | 1% | 93% | 6% | -5% | 46.8 |
| Dec/21 | 1% | 95% | 4% | -3% | 47.5 |
| Jan/22 | 8% | 89% | 3% | 5% | 50.0 |
| Feb/22 | 6% | 89% | 5% | 1% | 49.3 |
Background on the ISM-Houston Business Report and HPMI Calculation Methods
The Houston Purchasing Managers Index has been included as an integral part of the ISM-Houston Business Report since the Houston chapter of the Institute for Supply Management started publication of this document in January 1995. The report and index are published monthly as the primary deliverables from a survey of Houston area Supply Chain leaders regarding the status of key activities believed to provide insight into the strength of the economy. The respondents come from diverse organizations including construction, energy, engineering, health care, durable and non-durable goods manufacturing, financial and business services, wholesale and retail trade, and utilities related companies.
The Houston Purchasing Managers Index is determined from diffusion indices of the eight indicators of economic activity covered by the ISM-Houston Business Survey and Report. These underlying indicators are sales or new orders, production, employment, purchases, prices paid for major purchases, lead times from sellers, purchased materials inventory (raw materials and supplies), and finished goods inventories. The respondents to the survey report the direction of each these activities as either up, the same or down in comparison to the previous month. An index for each of these areas is then calculated by subtracting the percentage of respondents that sight a negative shift from the percentage that sight a positive shift. For indicators that are positively correlated with economic growth, this results in an underlying index that points to expansion when it is above zero. Indicators that are negatively correlated with growth point to expansion when they are below zero.
The final Houston PMI is calculated by applying optimal regression factors to each of the eight underlying indicators noted above. These regression factors are determined using standard regression techniques comparing these underlying indicators to the Houston-The Woodlands-Sugar Land Business Cycle Index (Houston BCI), which is reported on a monthly basis by the Federal Reserve Bank of Dallas. This top-level index is converted to a 0 to 100 scale to match that of the national Purchasing Managers Index® (PMI®) which is published monthly by the Institute for Supply Management® (ISM®). Readings over 50 for the HPMI generally indicate manufacturing expansion in the Houston in the near term and readings below 50 show coming manufacturing contraction.
It is important to note that the manufacturing breakeven HPMI does not equate to the breakeven point for the overall Houston economy. ISM-Houston periodically reviews the capability of its correlations and adjusts the regression factors when appropriate. The most recent revision occurred as a result of a review undertaken during the third quarter of 2018, which determined that changes in the Houston economy over the last decade have shifted the intercept of the correlation, causing a neutral Houston PMI to no longer align with a neutral Houston BCI. A Houston PMI of 45 points now equates to a neutral Houston economy as measured by the Houston BCI. A similar offset between the National PMI and the National economy has existed for some time.
Use of ISM-Houston Business Report Content
All information contained in this report is protected by copyright laws and ISM-Houston retains all rights to this Content. ISM-Houston hereby grants you a limited, revocable license to access, print, and display this Content solely for your personal, non-commercial use. Requests for permission to reproduce or redistribute ISM-Houston Business Report Content can be made by contacting the ISM-Houston Business Survey Committee at hpmi@ism-houston.org.
ISM-Houston shall not have any liability, duty, or obligation for or relating to the ISM-Houston Business Report Content or other information contained herein, any errors, inaccuracies, omissions or delays in providing any ISM-Houston Business Report Content, or for any actions taken in reliance thereon. In no event shall ISM-Houston be liable for any special, incidental, or consequential damages, arising out of the use of the ISM-Houston Business Report.